Understanding how consumers engage with media is often a matter of understanding specific terms for each medium. That’s where the Comparable Metrics comes in to play. It serves to create a level playing field to measure users and usage across the U.S. population to arrive at an apples-to-apples view of consumption across TV, radio, TV-connected devices, PCs, smartphones and tablets.
The third-quarter report sets aside metrics commonly associated with only one type of content, such as video starts or page views, and focuses instead on three basic concepts equally applicable to all categories of media measurement:
- How Many: the number of adults who use a given platform or content type in a week.
- How Often: the number of days per week that those adults access the content.
- How Long: the amount of time the adults spend engaging with content.
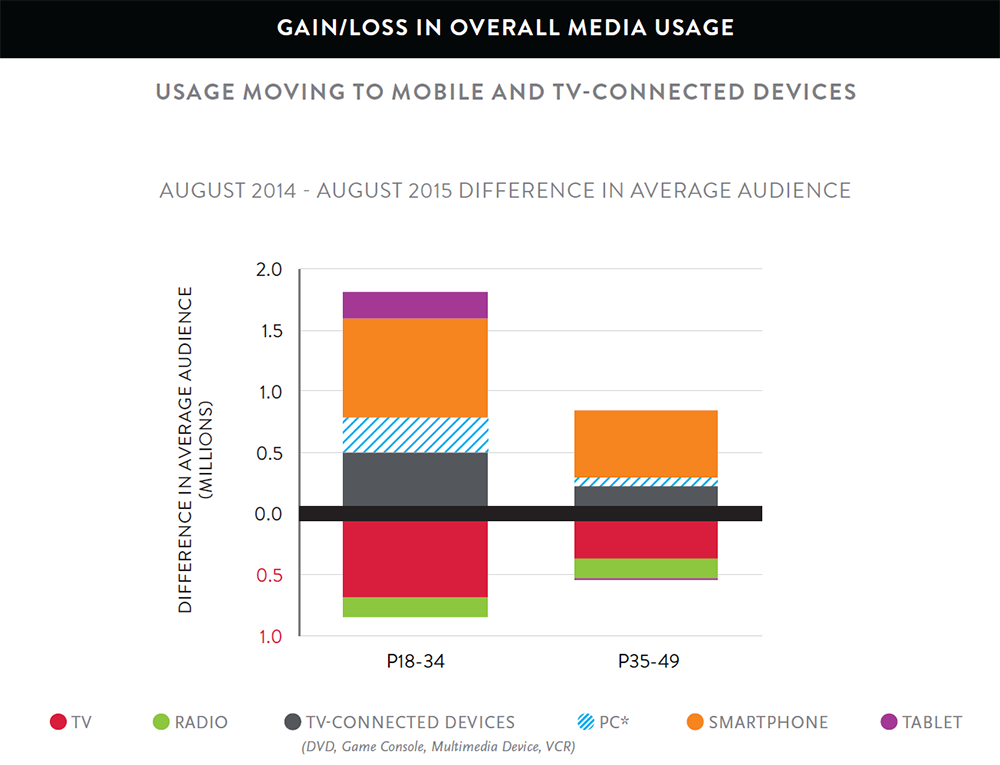
Overall Media Usage Trends
Media usage is moving to mobile and TV-connected devices. On a year-over-year basis, the total average audience across all platforms grew among the 18-34 and 35-49 demographics. Smartphones and connected devices experienced the largest increases.