Summer Olympics drive increases for broadcast and streaming, with Peacock up 33%.
Streaming hits 41.4% of TV, largest share for any viewing format in The Gauge’s history.
YouTube becomes first streaming platform to break 10% of total TV viewing.
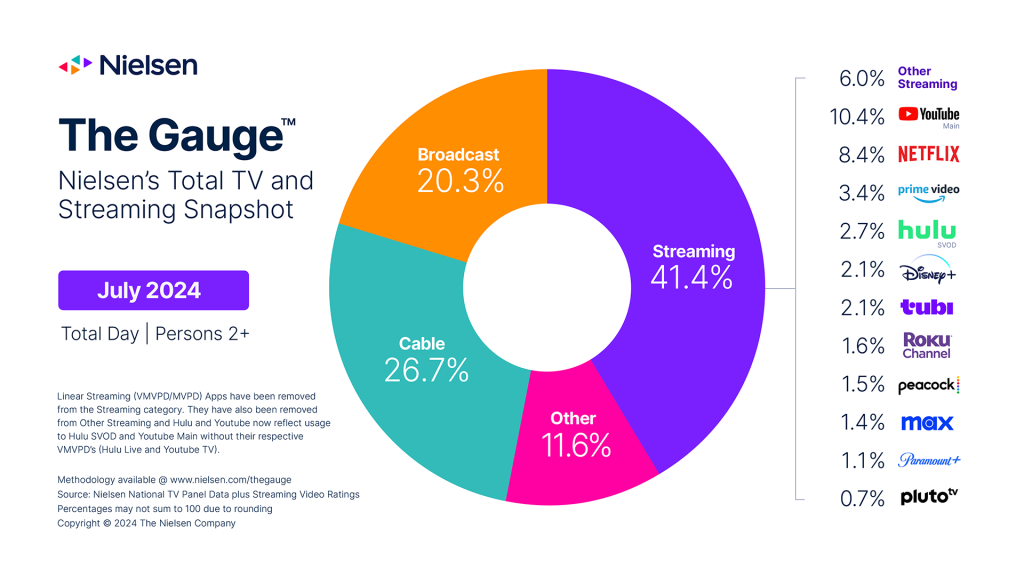
NEW YORK – August 20, 2024 – Streaming made TV history for a second consecutive month in July as it notched the most dominant performance by a single viewing category ever in Nielsen’s The Gauge™, accounting for 41.4% of TV viewing. Streaming levels were over 5% higher in July compared to June, leading streaming to grow its share of TV by more than a point (+1.1 pt.) and shatter the previous record it set just last month.
July also ushered in the beginning of the Summer Olympics in Paris, and despite only three days of coverage included in the July Gauge report, the impact the Games had on TV viewing was evident. Total TV usage was up 2.3% in July compared to the previous month, and up 3.5% compared to July 2023. Broadcast viewing increased slightly this month to 20.3% of TV, but was up 5% compared to a year ago. The category also finished 0.3 points higher than July 2023 when it recorded its lowest share ever (20.0% of TV). When TV usage is isolated by week, the start of Olympics coverage in the final week of July pushed the broadcast average up to over 22% of total TV. This is further emphasized by the fact that the Olympics accounted for the top five, and seven of the top 10, broadcast telecasts in the July report, with the largest audience averaging 19 million viewers on NBC on Sunday, July 28.
Peacock’s coverage of the Olympics vaulted the streamer to 1.5% of TV (+0.3 pt.) and its second best share of TV ever (behind 1.6% in Jan. 2024). Also boosted by viewing to Love Island USA, Peacock’s 33% monthly usage increase in July was the largest for any streaming platform in The Gauge. It was followed by two more streamers with double-digit monthly increases: Amazon Prime Video viewing was up 12% from June to notch 3.4% of TV (+0.3 pt.), its best since November 2023. The Roku Channel was up 10% and added 0.1 point to achieve a platform best 1.6% of TV.
July is typically a peak month for streaming usage, and this year, each week of the July interval* led to the top four most streamed weeks ever reported by Nielsen. The streaming fireworks kicked off with a notable week in Nielsen’s Streaming Top 10 when, for the first time ever, 10 titles exceeded 1 billion viewing minutes. What’s more, July 2024 now holds four of the top 10 most streamed days on record.
YouTube became the first streaming platform ever to exceed 10% of total TV usage in July. The most popular streamer shot up 7% versus last month, accounting for 10.4% of TV usage (+0.5 pt.). This comes after YouTube hit 9.9% of TV in June and secured the second largest share of TV viewing among all media distributors.
House of the Dragon on Max topped streaming programs in July with 4.7 billion viewing minutes, also helping to drive an increase of over 4% for the streamer to retain its 1.4% share of TV. It was followed by Bluey on Disney+ with 4.3 billion viewing minutes in July. Disney+ usage was up 9.2% this month to finish with a platform best 2.1% of TV. Prime Video’s original series The Boys was third among streaming programs with 4.2 billion viewing minutes.
Cable viewing in July was even compared to June, but due to the larger increase of overall TV usage, the category lost half a share point and ended the month with 26.7% of TV. Cable news viewing saw a strong increase in July, driven by the Republican National Convention and coverage of the assassination attempt on former President Trump. The news genre was up 23% compared to June, and up 52% compared to July 2023. Of July’s top 25 cable telecasts, Fox News Channel owned 24 of them.
* The measurement month of July 2024 included four weeks: 07/01/2024 through 07/28/2024. Nielsen measurement weeks begin on Mondays and run through the following Sunday.
About The Gauge™
The Gauge™ is Nielsen’s monthly snapshot of total broadcast, cable and streaming consumption that occurs through a television screen, providing the industry with a holistic look at what audiences are watching. The Gauge was expanded in April 2024 to include The Media Distributor Gauge, which reflects total viewing by media distributor across these categories. Read more about The Gauge methodology and FAQs.
About Nielsen
Nielsen is a global leader in audience measurement, data and analytics. Through our understanding of people and their behaviors across all channels and platforms, we empower our clients with independent and actionable intelligence so they can connect and engage with their global audiences—now and into the future. Learn more at www.nielsen.com and connect with us on social media (X, LinkedIn, YouTube, Facebook and Instagram).
Press Contact
Lauren Pabst
lauren.pabst@nielsen.com
