Big data keeps making headlines, but what is it exactly, and why is it both a gift and potential impediment to accurate audience measurement? We dig into the pros and cons of big data and the ways to make it work.
What is big data?
In the linear media world, big data typically refers to two types of data streams produced by the very systems that deliver programming to end users: Return-path data (RPD) from cable or satellite set-top boxes (like Dish or DirecTV), and automatic content recognition (ACR) from internet-connected smart TV sets (like Samsung or Vizio).
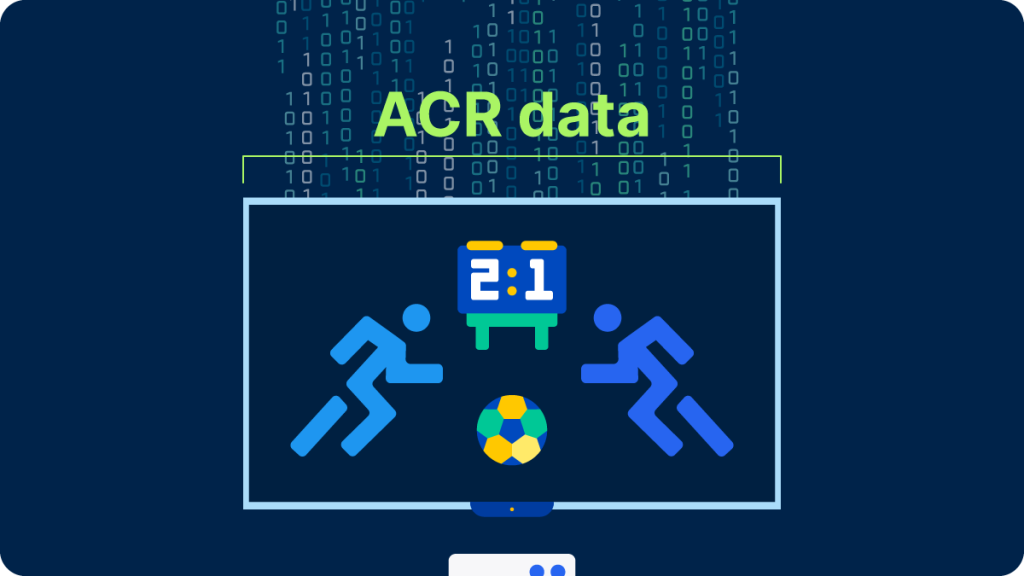
ACR data
Rather than a log of channel changes, ACR technology monitors the images on the TV screen. The images act like fingerprints, which get compared to a large reference library to identify what the program or ad actually is. Images are time stamped to understand when the playback is happening.
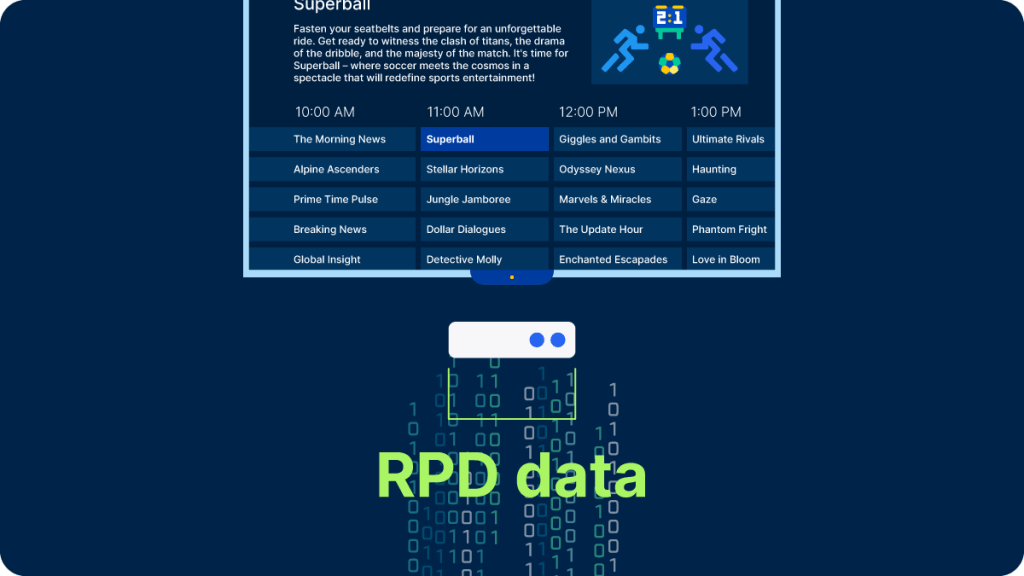
RPD data
Records what channel the set-top box is tuned to and what time channel changes are taking place. That data can be matched to a TV schedule to determine what program is playing at that particular time, and with data from the provider’s ad servers or its partners to figure out what advertising the household is exposed to.
In both cases, end users allow data collection on their devices. Cooperation is relatively high because data collection drives not just measurement but also much-desired features like user preferences and content recommendations. An RPD or ACR dataset might cover well over 30 million devices.
Why is big data a big deal?
There was a time when people had only a handful of channels to choose from. A household rating1 over 60 (like the finale of M*A*S*H in 1983) or even 40 (like the Seinfeld finale in 1998) is unfathomable for a scripted show today. We live in a much more fragmented world, with a very long, long list of programming options.
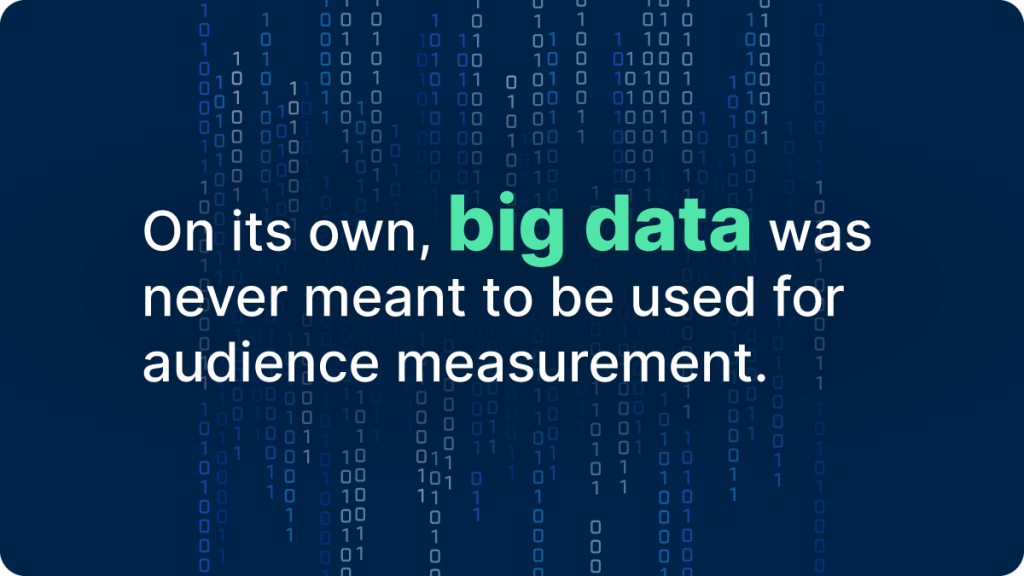
That’s great for TV viewers, but it complicates things for panel-based research: In a nationwide panel with 101K people, a TV show with a 0.2 rating will be seen by 80 households, and perhaps only one in the Atlanta or Dallas metro area. With tens of millions of devices under measurement, big data makes it possible for research companies to report TV usage at a much more granular level, providing coverage for many more programs with small and often diverse audiences. But on its own, big data was never meant to be used for audience measurement. We will dive into some of the pros and cons of big data in audience measurement.
The limitations of big data
Challenge #1: Big data isn’t representative
To transact with confidence, media buyers and sellers need a measurement solution that reflects the population in all its diversity: All age groups, races, ethnicities and many other key demographic and behavioral characteristics need to be present and proportional in the underlying data.
But size doesn’t guarantee representativeness. When analyzing installed counts in the Nielsen National TV panel, we’ve found that homes with RPD are disproportionately older and less racially diverse than the general population. Hispanic households, for instance, are underrepresented by about 30%, and heads of household under the age of 25 are almost entirely absent from RPD datasets. On the other hand, ACR datasets skew younger than the general population, and have more household members, too. Using statistical weighting in big data may hide the issue, but it can’t make up for the missing, unique viewing behaviors of underrepresented audiences.
To make matters worse, a measurement solution relying exclusively on RPD and ACR data would miss over-the-air2 and streaming-only households, which are a growing piece of the pie.
Challenge #2: Big data may not capture all viewing behavior
Even if they included representative households, RPD and ACR datasets don’t capture viewing from every set-top- box set in the household or from other TV sets in the home that aren’t smart TVs. Those additional TV sets may play different programs to different family members (like cooking shows in the kitchen, or kids’ programs in the playroom), so not only are big data households not representative of the population, but the big data itself isn’t representative of all the viewing that may be happening in those homes.
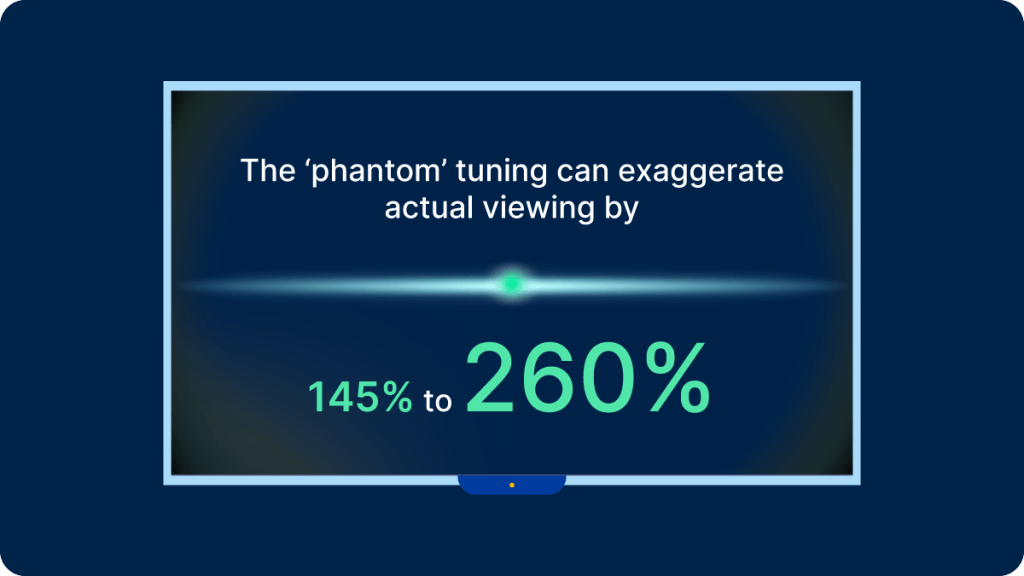
A frustrating issue for research companies relying on RPD is that the set-top box often remains on when the attached TV set is turned off. That ‘phantom’ tuning can exaggerate actual viewing by 145% to 260%, depending on the provider. There are models that can be implemented to compensate for it, but without a point of reference—like a panel informed by real viewing—it can be difficult to develop the right heuristics.
ACR isn’t immune from data quality issues either. Some smart TV streaming applications block ACR from capturing the content on screen while the app is in use. It may look like the TV set is off when in fact the content has been blocked by an app. And most providers monitor only a small portion of all available programming. In a recent analysis, we found that ACR providers currently monitor just 31% of all available stations, and 23% of recorded minutes are still coming from stations that aren’t monitored. With no reference fingerprints to compare to, that viewing goes unreported.
Challenge #3: Big data is missing viewer demographics
RPD and ACR providers capture tuning data from millions of devices, but they don’t know who’s watching, which is what advertisers are ultimately asking for.
One way to make up for that shortcoming is to team up with third-party demographic suppliers. Those companies maintain a record of the demographic composition of every household in the country, and a research company might attempt to model who is watching what simply from the total sum of tuning data in a given household and that household’s demographic composition.
A kid’s program? That must be from a child in the house. A wrestling match? That must be from a male viewer. Without a real-life reference point to assist the machine learning algorithm, you can easily see where this type of modeling might break down. Unsurprisingly, it gets progressively less reliable with the size of the household, and that ends up hurting the accuracy of the data for larger families, like those with children, non-white and younger viewers.
The advantages of panel data
For brands and media companies looking for a stable, reliable audience measurement solution, the challenges outlined above are nonstarters. Panel data is critical to overcome those limitations.
At Nielsen, when we analyze RPD or ACR data, we’re able to identify what homes and devices are part of our panels, and compare the tuning data in those homes to the viewing behavior captured by our meters. By using our panels as a source of truth in those homes, we can pinpoint where big data deviates from the truth and develop robust models to adjust for those anomalies.
For example, we developed a methodology to work out where a device is located inside a house and match its tuning data to specific viewers. Another model helps us determine whether a TV set is off while the set-top box is on. Yet another model can sort out device updates that register as extra tuning, as well as situations where a device returns more than one tuning event at the same time.
People, not devices
Ultimately, audience research is about people, not devices.
There’s no doubt that big data is a great addition to the media researcher’s arsenal. It opens the door to more granular reporting than was ever possible in the past. But it’s inherently faulty, biased and, most fundamentally, shortsighted: It captures tuning data, not viewing data.
To fulfill its potential, it needs to be cleaned up, filled in, calibrated and enriched with relevant demographics. That’s where panel data comes in. Machine learning works best with strong training and validation data, and there’s no better training data in the industry than the nationally representative panel data that sits at the heart of today’s media research business.
Nielsen’s Need to Know reviews the fundamentals of audience measurement and demystifies the media industry’s hottest topics. Read every article here.
Note
1 A household rating is the percentage of all households in the country tuned to a given program.
2 Programming available via a “signal” from an antenna. Over the air (OTA) broadcasts were the first type of TV available.