With Halloween around the corner, our thoughts turn to candy corn, gummy spiders and mini chocolate bars. But U.S. consumers today also crave another treat. Sure, candy apples are great, but mobile apps are also satisfying.
According to the second-quarter 2014 Cross-Platform report, U.S. adults (18+) spent an average of 43 hours and 31 minutes per month connecting with content through an app or mobile web browser—up from 33 hours and 48 minutes per month in the same quarter in 2013. Among African-American and Hispanic adults (18+), that average monthly time spent was even higher, at nearly 53 hours and 49 hours respectively!
Trick-or-treaters tend to stock up on more candy than they actually need, and English-speaking U.S. mobile app consumers seem to be no different. While the average smartphone downloader has around 42 apps on their device, the majority (87%) claim they use less than 10 apps on a daily basis while 55% say they use between one and four apps and 32% report using between five and nine, according to Nielsen’s Mobile Apps Playbook. Meanwhile, the average tablet downloader has around 35 apps on their device, with 89% claiming they use less than 10 apps on a daily basis.
But phones and tablets aren’t the only way to access apps these days. On average, those who have downloaded an app on their smart TV have 12 apps on their device. Wearable downloaders have an average of four apps on their devices.
So why are consumers downloading apps?
Apps are fun! Consumers cite leisure or entertainment (53% of smartphone owners/59% tablet owners) and a recommendation from a friend (48% smartphone owners/44% tablet owners) as their top reasons for downloading an application. Among tablet owners, 48% also say they download an app because they have the same or similar app on another device.
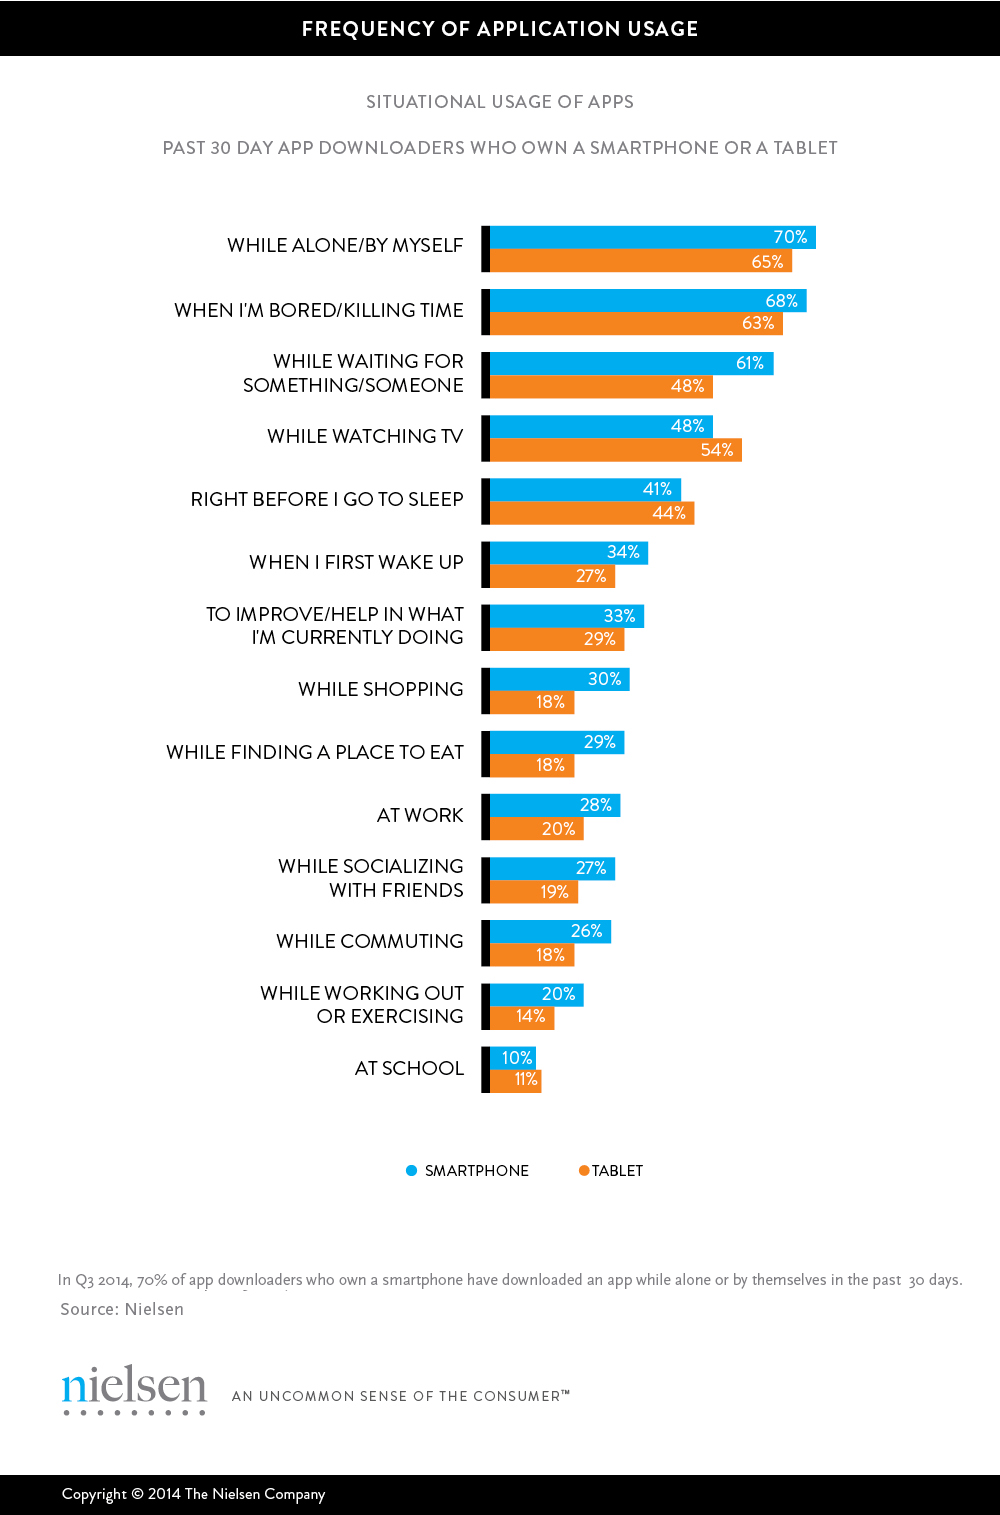
Consumers are maximizing their downtime by using apps, presenting marketers and app developers with a potential opportunity to reach these consumers while they are unoccupied. In third-quarter 2014, 70% of app downloaders who own a smartphone said they used apps while alone or by themselves, 68% used apps while they were “bored” or “killing time” and 61% while waiting for something or someone. Sixty-five percent of tablet users use apps while they are alone.
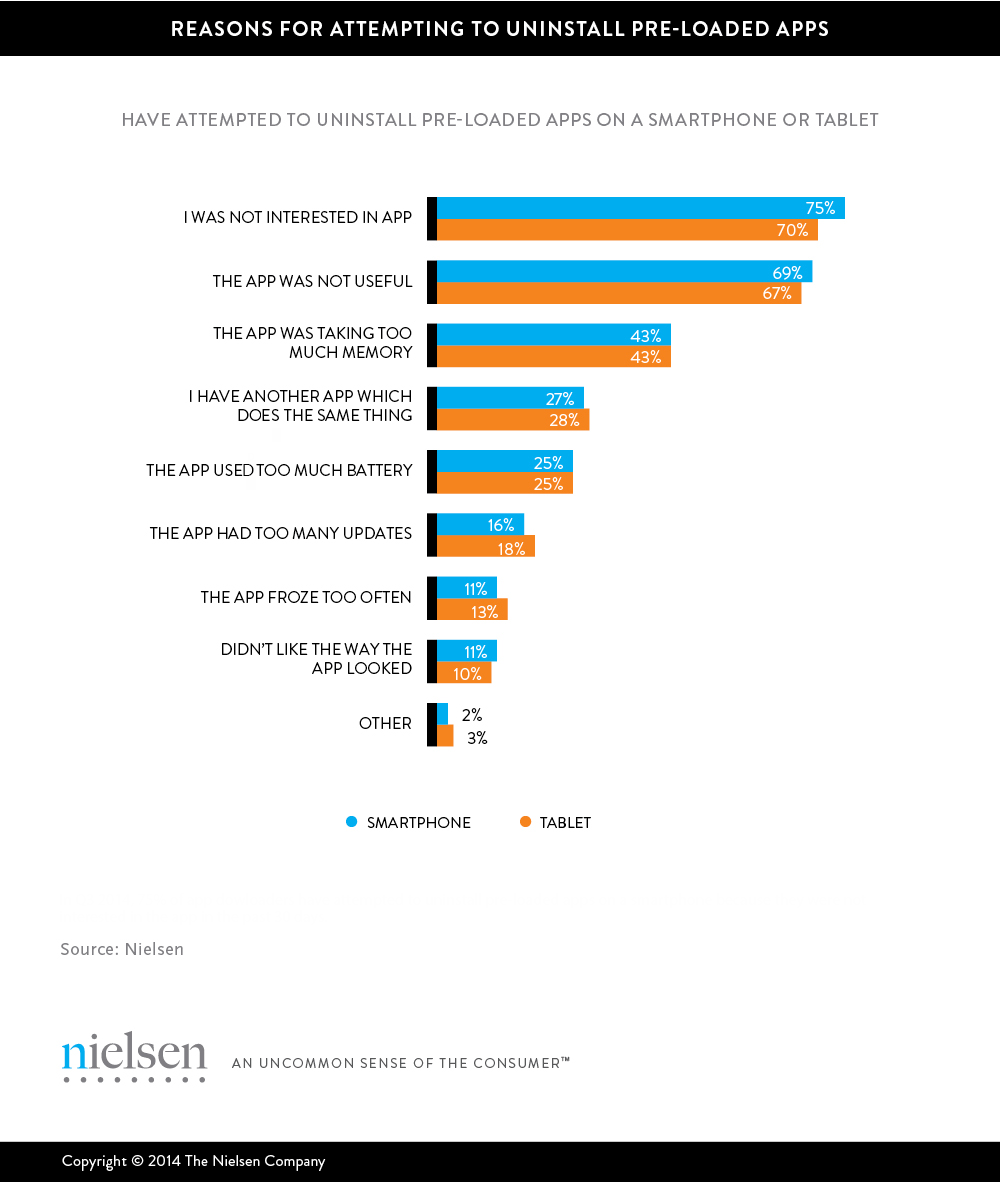
While apps provide marketers a unique opportunity to engage consumers, downloaders who prefer free treats, keep a tight hold on wallets when personally investing in apps and lean more towards useful apps. App downloaders say they will pay for games, reading (books/magazines), music and video/movie apps. On the other hand, 40% say they won’t pay for social networking, discount/coupon or payment apps. Of course, some apps come with phones, and when consumers don’t want these pre-loaded applications, users cite not being interested in the app (75% smartphone/70% tablet), finding the app not useful (69% smartphone /70% tablet) or the app taking up too much memory (43% smartphone/43% tablet) as top reasons for uninstalling.
Nielsen App Playbook Methodology
The insights from Nielsen’s Mobile Applications Playbook were gathered from 3,743 respondents’ age 13+ years who have downloaded an application to their device in the past 30 days. The distribution by device is 2,707 smartphone owners and 1,027 tablet owners. The respondents completed an online, self-administered, English-language survey in August 2014. Past 30-day downloaders were identified through Nielsen’s Mobile Insights syndicated tracking study.
Mobile Methodology
Nielsen’s Electronic Mobile Measurement (EMM) is an observational, user-centric approach that uses passive metering technology on smartphones to track device and application usage on an opt-in convenience panel. Results are then reported out through Nielsen Mobile NetView 3.0. There are approximately 5,000 panelists in the U.S. across both iOS and Android smartphone devices, and this method provides a holistic view of all activity on a smartphone, as the behavior is being tracked without interruption. A number of steps are taken after the data collection process to ensure the reported data is representative of the mobile population. Weighting controls are applied across five characteristics (gender, age, income, race, and ethnicity).