Today’s TV audiences often use social media while watching live series programs, with many authors gathering on Twitter each week while viewing. According to recent research from Nielsen, Tweets sent during live airings, which make up the majority of weekly series program Tweets, could affect more than just those tuning in live. They also lead to valuable promotional impressions for networks looking to build viewership later in the week through on-demand, DVR, or streaming.
So what share of Twitter impressions (total number of times Tweets are seen) for TV programs are coming from live Tweeting, as opposed to Tweeting throughout the rest of the week?
To find out, we looked at TV-related Tweets and impressions for 96 weekly series programs this fall. Nielsen now measures Twitter TV activity on a 24/7 basis in addition to its core linear measurement, which enabled us to measure Tweets and the number of times those Tweets were seen (impressions) during live airings and at times when programs weren’t airing live.
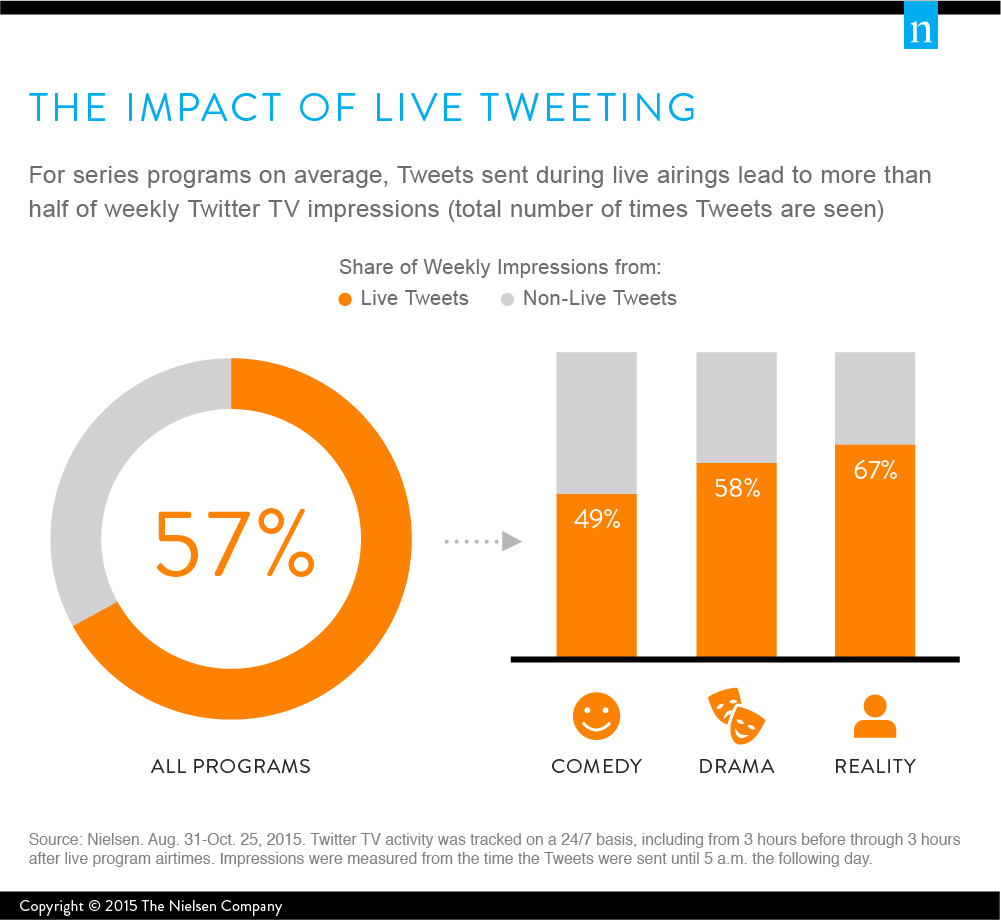
The study found that on average 57% of weekly impressions come from users seeing Tweets related to live airings. In other words, posts on Twitter related to a single live telecast (e.g., a one-hour or 30-minute episode) led to more than half of the weekly Twitter impressions for series programs. But viewers use Twitter differently depending on the genre. For drama and reality programs, live impressions jump to 58% and 67%, respectively. Meanwhile, comedies see just 49% of weekly impressions from live, suggesting that mentions when a program is not airing live could have more impact for the genre.
The study also found that the audience reached by live program conversation sees twice as many Tweets, on average, compared to the audience reached by Tweets sent during times without a live airing. With the frequency of social impressions increasing during live airings, this could be an impactful time to promote and cross-promote programs through social media.
As TV audiences on Twitter see multiple program-related Tweets, their posting behavior may also change. A separate Nielsen study analyzed Twitter TV activity during the 2014-2015 Broadcast TV season and found that two notable shifts take place during live series airings.
First, the nature of conversation shifts. On days without a live program airing, just a third (33%) of comments are sent in response to program content. During live airings, in addition to conversation volumes spiking, the share of comments sent in response to programming jumps to nearly two-thirds (65%). In fact, Twitter activity during live airings is so closely related to on-screen moments and stories that it was found to be indicative of the engagement of the general viewing audience.
Looking beyond those Tweets sent in response to on-screen content, the remaining share of program-related Tweets tend to reference a program’s brand and/or express excitement ahead of upcoming episodes. These general program mentions account for more than two-thirds of program Tweets on days without a live airing.
As networks invest in program promotions ahead of new series, seasons or episodes, evaluating Twitter program buzz on a 24/7 basis could serve as an additional signal of program awareness.
Second, the number of Tweets posted per author increases. Nielsen found that, on average across programs, authors that Tweet about live airings send twice as many Tweets as those authors that only Tweet when a program is not airing live. Some live-Tweeting authors also Tweet on days without a live airing. These highly social fans make up 8% of weekly program authors and send five times as many Tweets per author during live airings compared to authors who only Tweet when programs are not airing live.
Perhaps most importantly, these findings suggest the potential to engage with different types of authors, based on when and how they Tweet about programming. For instance, different messaging could reach authors who Tweet when a program is not airing live, those who Tweet during live episodes and those who Tweet throughout both periods.
In summary, the unique aspects of live and non-live Twitter TV behavior present four key opportunities for networks, agencies and advertisers, who can utilize these findings to maximize the impact of their programming and promotions strategies:
- Twitter TV activity during live airings drives the majority of valuable promotional impressions for weekly series programs.
- Audiences see Tweets with higher frequency during live airings, suggesting that this could be a powerful time to promote and cross-promote programs through social media.
- Live Twitter activity serves as a measure of content response and general audience engagement. By contrast, when programs are not airing live, program buzz becomes a signal of program awareness on social media and can be used to evaluate how effectively promotions are generating buzz.
- As networks look to drive engagement and viewership through promotional strategies on Twitter, they can reach unique segments of program authors based on when and how each group Tweets about programming.
METHODOLOGY
Nielsen analyzed 96 weekly series programs on English- and Spanish-language broadcast and cable networks airing episodes between Aug. 31-Oct. 25, 2015. Twitter TV activity and reach for two weeks of each program was tracked on a 24/7 basis, including linear tracking from 3 hours before through 3 hours after live program airtimes. Impressions were measured from the time the Tweets were sent to 5 a.m. the following day.
Separately, Nielsen analyzed 24/7 and linear Twitter TV activity from Sept. 2014-May 2015 for 52 weekly series programs on English-language broadcast and cable programs, focusing on four weeks towards the end of each programs’ season. Each program week included the live airing and following six days. Programs were not airing in syndication during the time period of the analysis and had at least 1,000 Twitter TV authors per new/live episode. Qualitative analysis was conducted on a subset of 18 of these programs, analyzing the content of Tweets sent from three hours before through three hours after live airings (live) and on days without a live airing (non-live), for two-week periods during each program’s season.