Whether watching TV, checking emails, or flipping through a magazine, it seems like everywhere we look there’s an opportunity for advertisers to connect with us, earn our trust and deliver their message. Has media proliferation watered down the resonance of their message? A recent Nielsen global survey found that trust levels in advertising have remained fairly consistent across earned, owned and paid formats over the past two years. Furthermore, among global respondents, self-reported action levels as a result of advertising actually exceeded trust levels for 14 of 19 advertising formats reviewed, suggesting that trust is not always a prerequisite to purchase.
Taking a deeper look, how does age and where we live impact our trust levels and willingness to take action? Not in the ways you might expect.
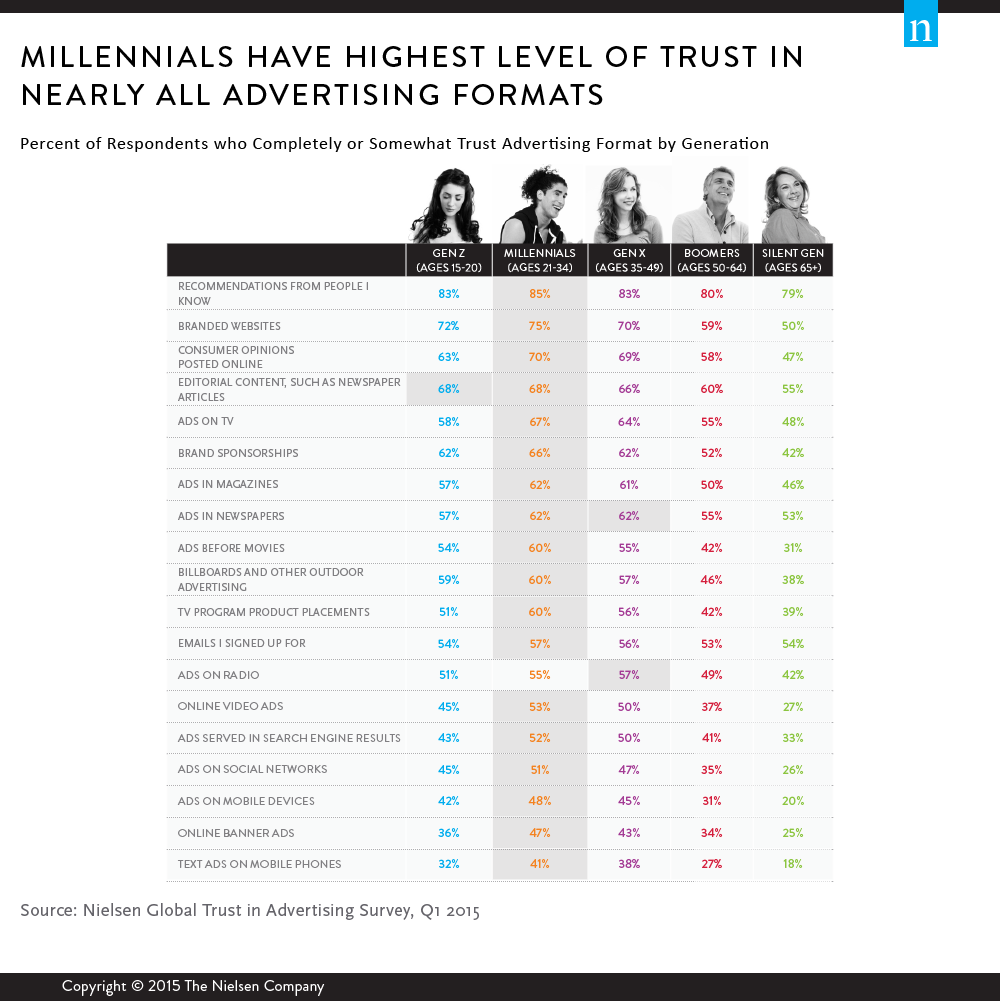
Millennials (age 21-34), who came of age with the Internet, have the highest levels of trust in online and mobile formats, followed closely by Generation X (age 35-49). While that may not come as a surprise, it’s not just online and mobile advertising formats where Millennials exceed the average. They also show the highest levels of trust in 18 of 19 advertising formats/channels, including TV, newspapers and magazines, and they’re also the most willing to take action on 16 of 19 formats.
“Millennials consume media differently than their older counterparts, exercising greater control over when and where they watch, listen and read content—and on which device,” said Randall Beard, president, Nielsen Expanded Verticals. “But even if they rely less heavily on traditional channels, their trust and willingness to act on these formats remains high. While an integrated, multi-channel approach is best across all generations, it carries even more importance when reaching Millennials.”

Trust and action levels are highest in developing regions
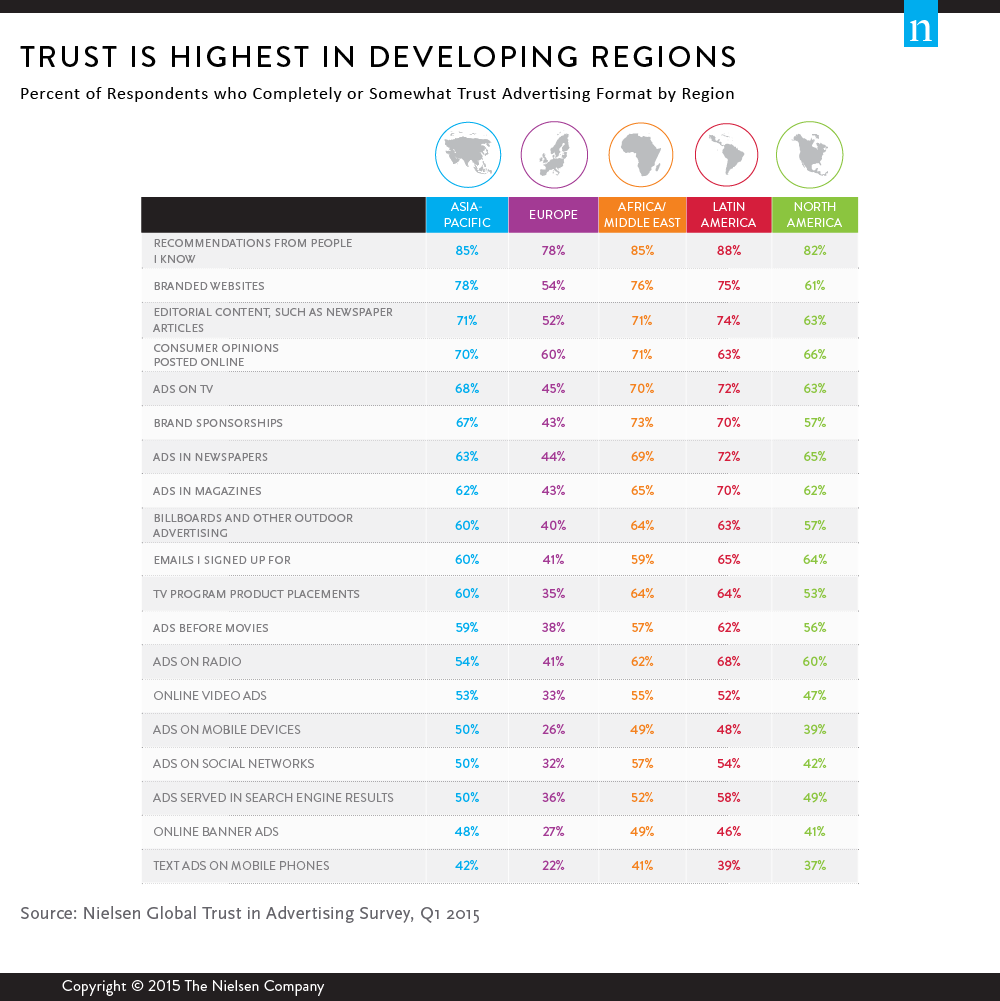
Shifting focus to responses around the world, trust levels for each type of advertising format reviewed are highest in developing markets. Latin America leads the way, demonstrating the highest levels of trust for 10 of 19 advertising formats, with many of these representing traditional formats. Africa/Middle East shows the highest reported levels for seven of 19 formats, with these representing a mix of both online and offline formats. Finally, Asia-Pacific reports the highest levels of trust for three formats, including both ads on mobile devices and mobile text ads. Respondents in these regions were also more likely to say they take action on advertising formats at least some of the time.
European respondents are most skeptical about advertising, with the lowest reported levels of trust for all 19 formats. They’re also least likely to say they take action on nearly all (18 of 19) advertising formats.
In North America, the results are mixed. While respondents in the region report trust levels below the global average for nine of 19 advertising formats—including, most notably, branded websites—they actually exceed the global average for nearly as many channels (eight of 19). And this is the only region where trust is consistently (and considerably) higher than self-reported action.

Other findings from the report include:
- Self-reported action levels exceed trust levels by more than double digits for ads served in search engine results, ads on social networks and magazines.
- More than eight-in-10 global respondents (83%) say they completely or somewhat trust the recommendations of friends and family, while two-thirds (66%) say they trust consumer opinions posted online.
- Humorous ads resonate most in strongly in Western markets; health-themed ads are rated highest in Latin America; and ads depicting real-life situations are most appealing in Asia-Pacific and Africa/Middle East.
- High-energy/action advertising themes resonate more with younger respondents, while pets/animal-centered ads resonate more with older respondents.
For more detail and insight, download Nielsen’s Global Trust in Advertising Report.
About the Nielsen Global Survey
The Nielsen Global Trust in Advertising Survey was conducted between Feb. 23 and March 13, 2015, and polled more than 30,000 consumers in 60 countries throughout Asia-Pacific, Europe, Latin America, the Middle East, Africa and North America. The sample has quotas based on age and sex for each country based on its Internet users and is weighted to be representative of Internet consumers. It has a margin of error of ±0.6%. This Nielsen survey is based only on the behavior of respondents with online access. Internet penetration rates vary by country. Nielsen uses a minimum reporting standard of 60% Internet penetration or an online population of 10 million for survey inclusion. The Nielsen Global Survey, which includes the Global Consumer Confidence Index, was established in 2005.


