
The Gauge™
TV Viewing trends in the U.S.
Navigate the TV landscape with precision. Examine audience viewing behaviors across key TV delivery platforms in a monthly macroanalysis.

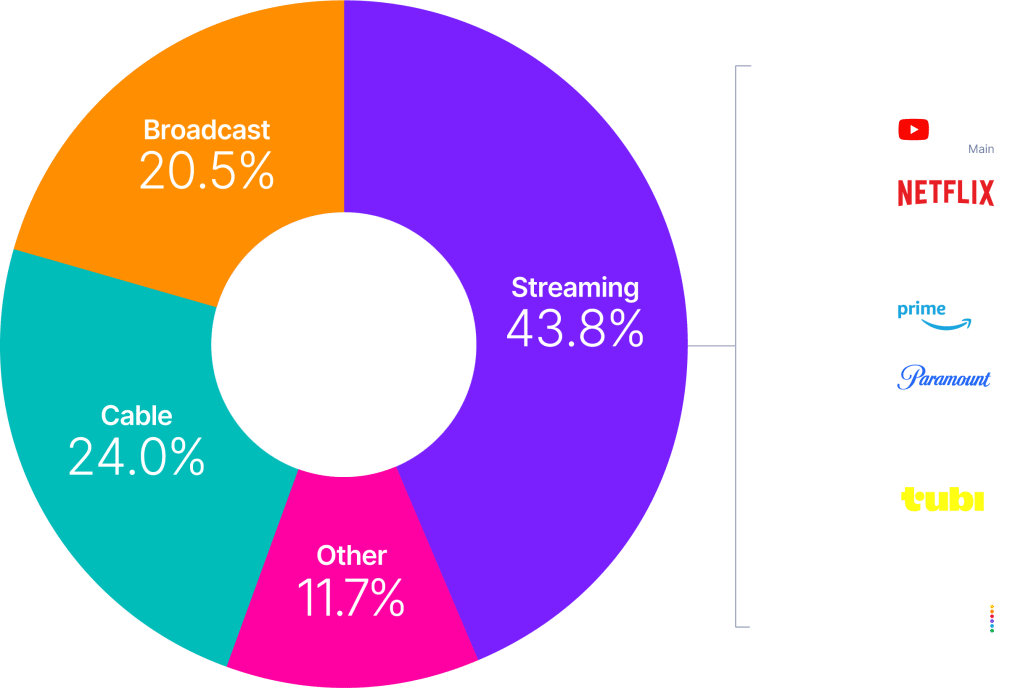
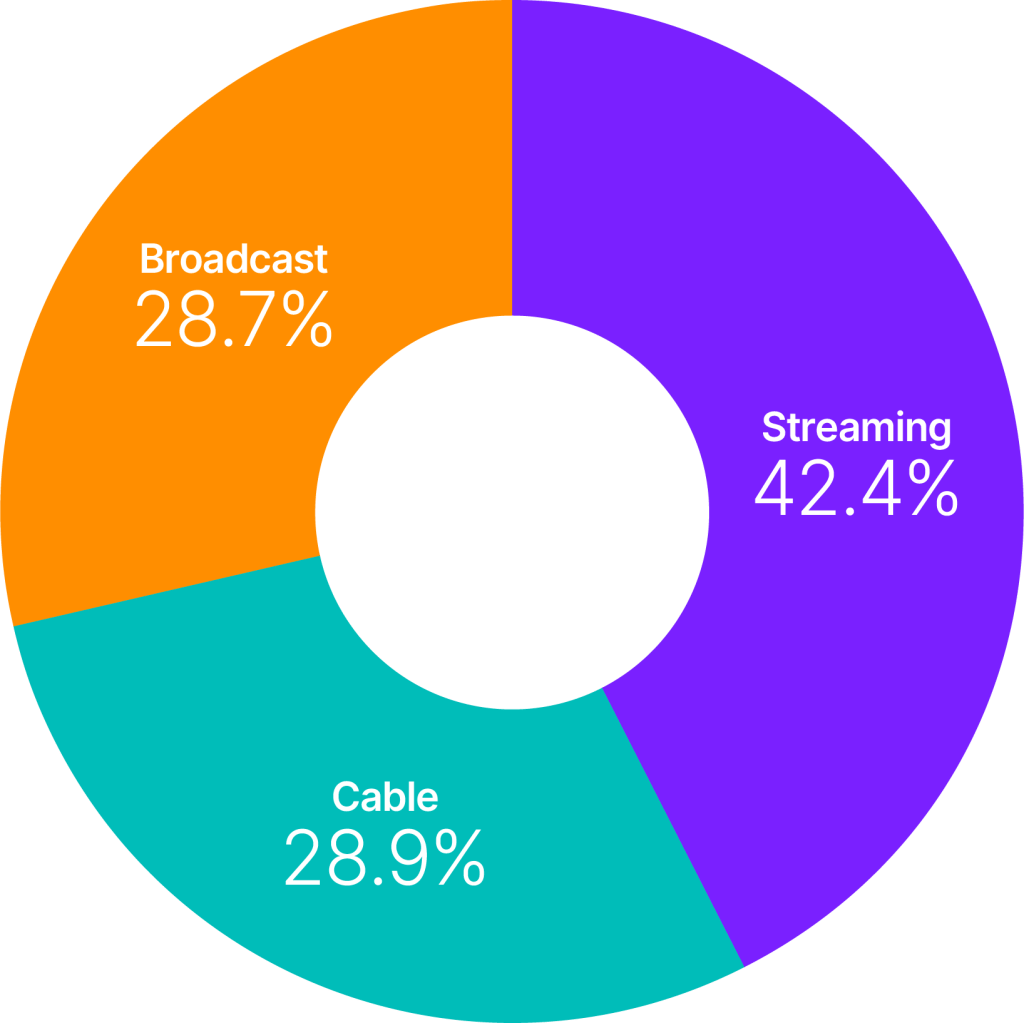
Explore how Americans watch TV across platforms
Monthly TV viewing by platform
March 2025
Total day | Persons 2+
Copyright © 2025 The Nielsen Company (US), LLC. All Rights Reserved.
TV viewing trends by platform
Copyright © 2025 The Nielsen Company (US), LLC. All Rights Reserved.
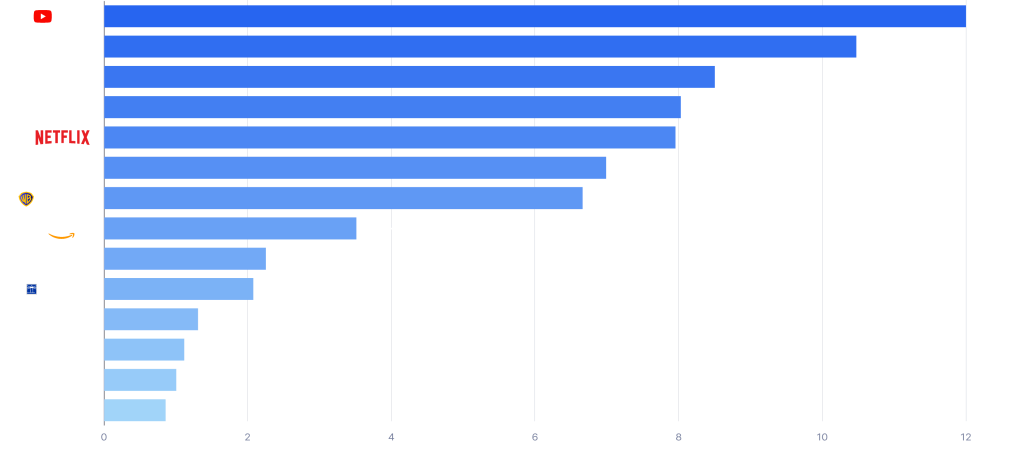
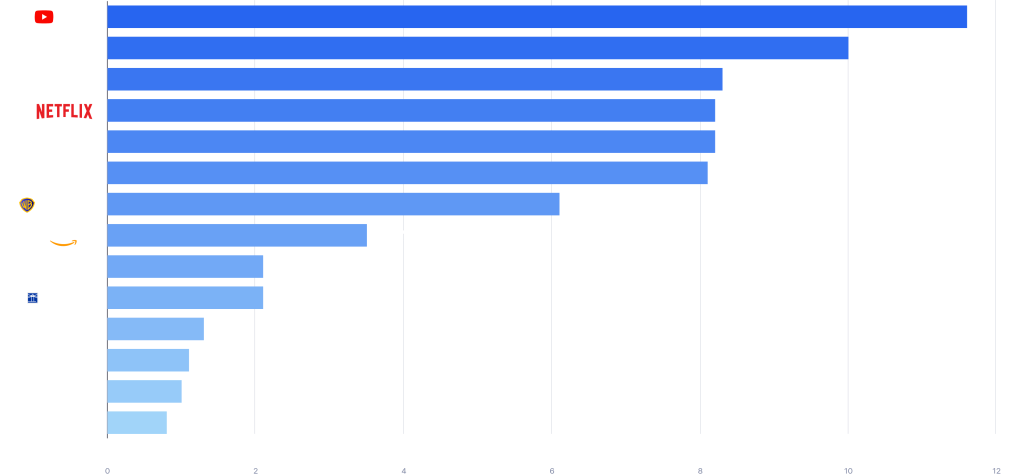
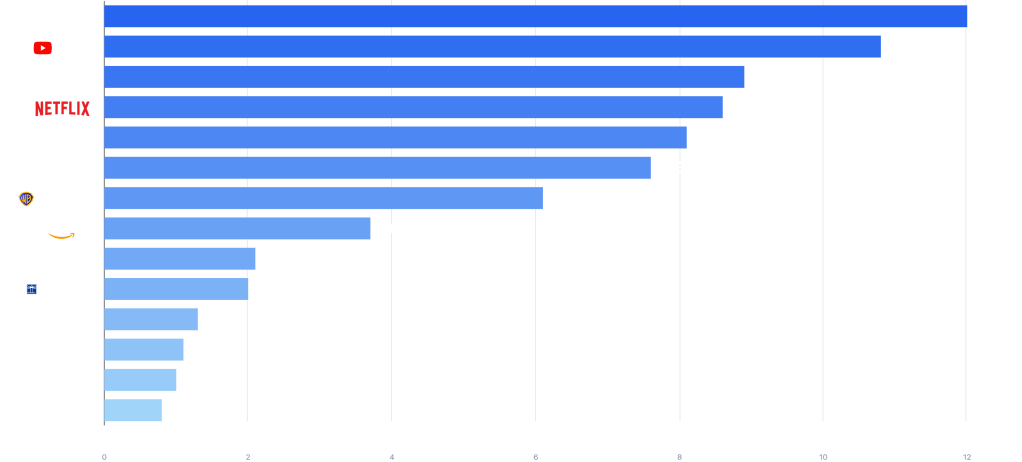
Discover how Americans watch TV across media distributors
Monthly TV viewing by distributor
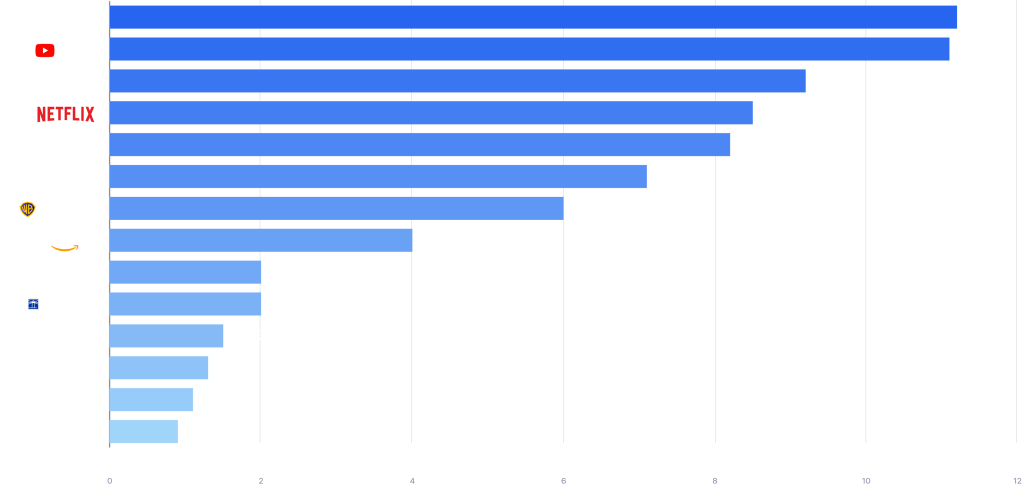
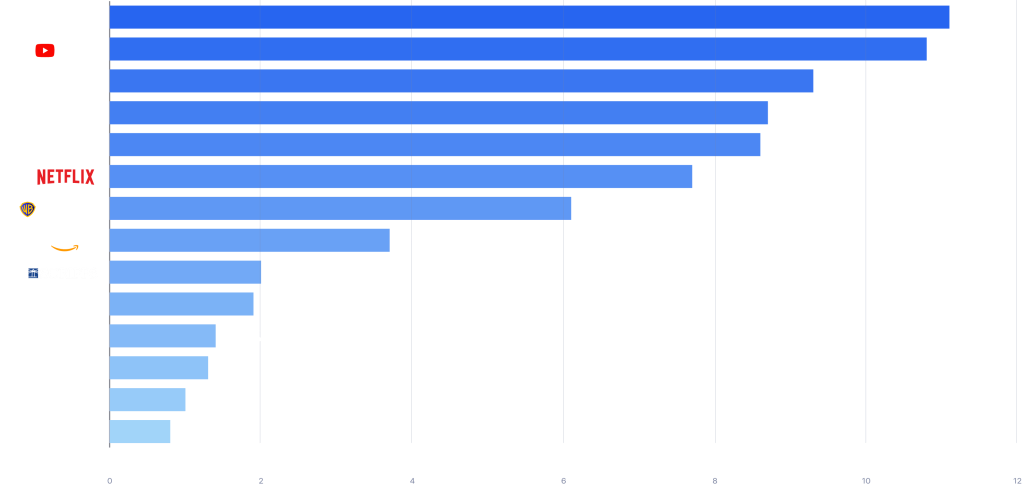
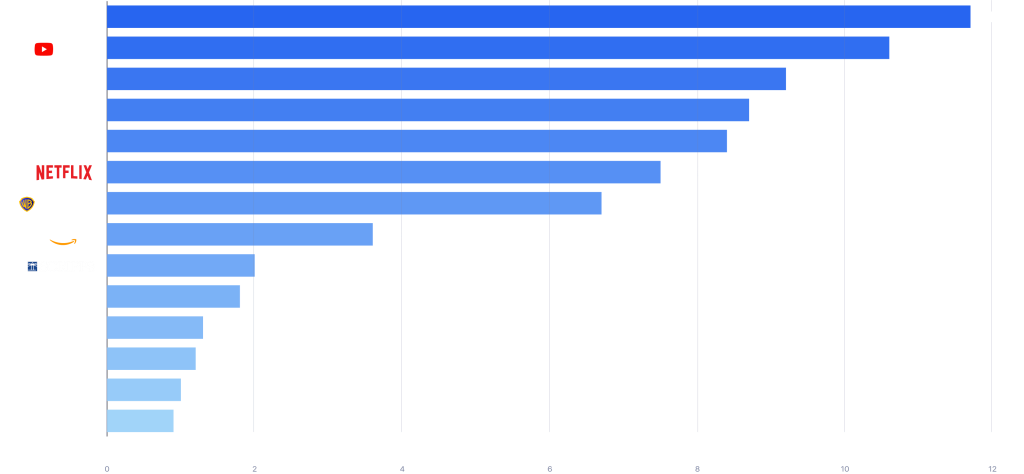
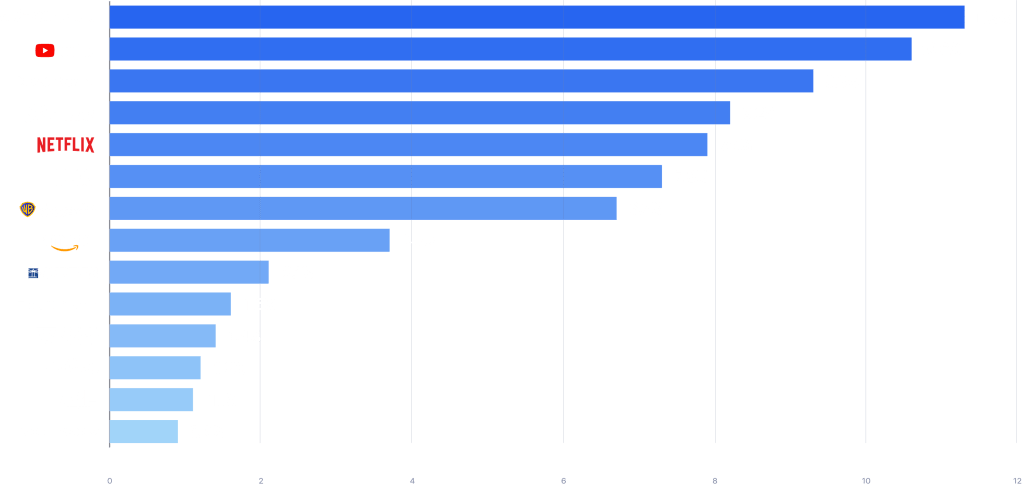
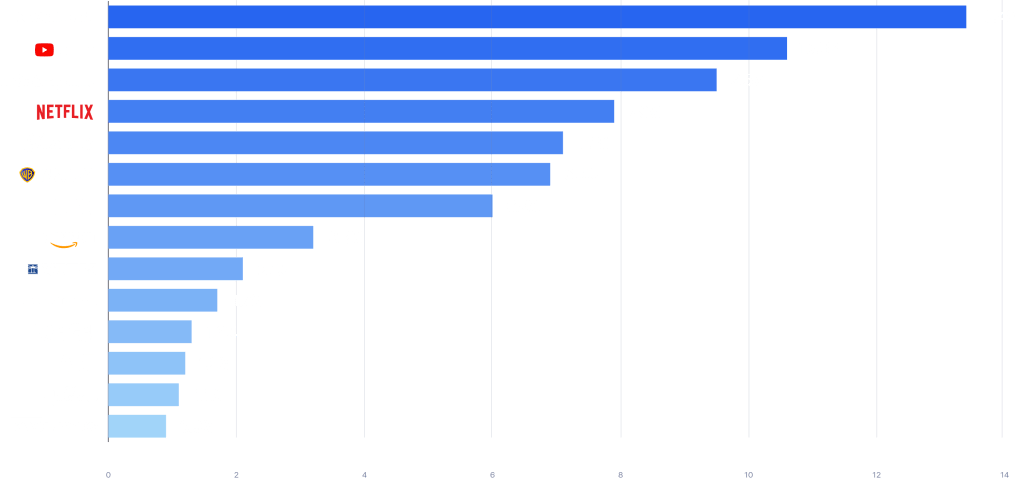
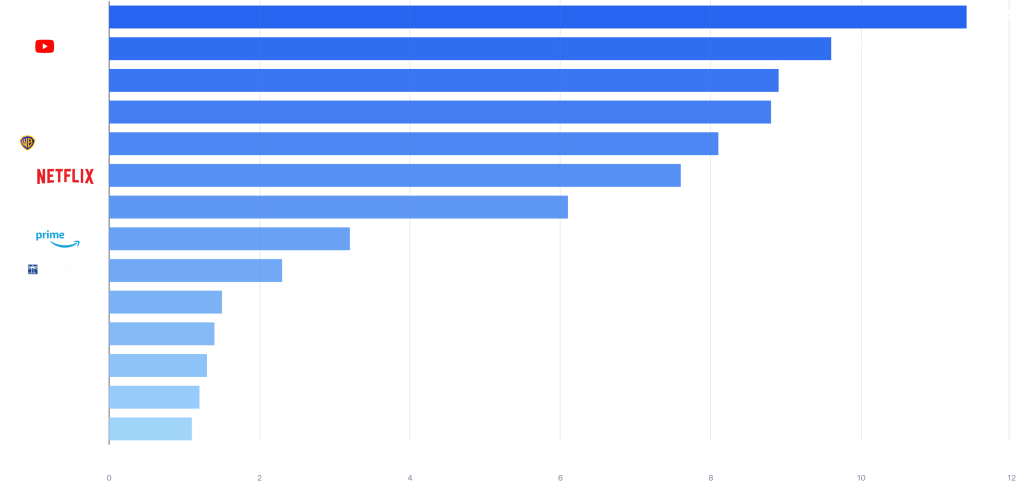
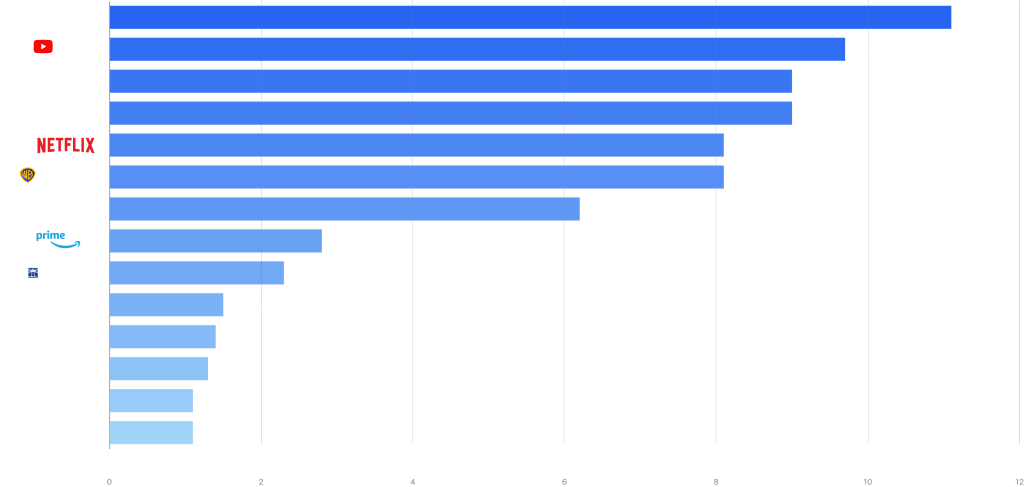
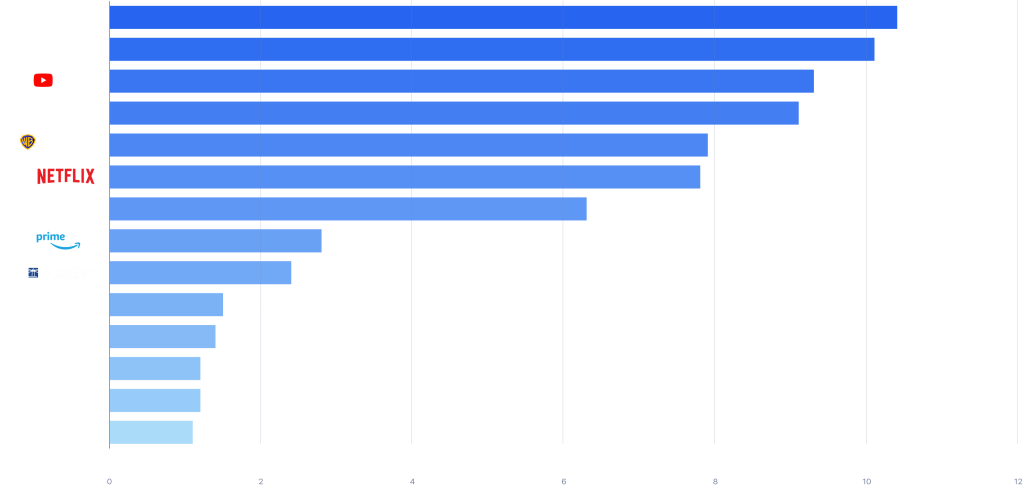
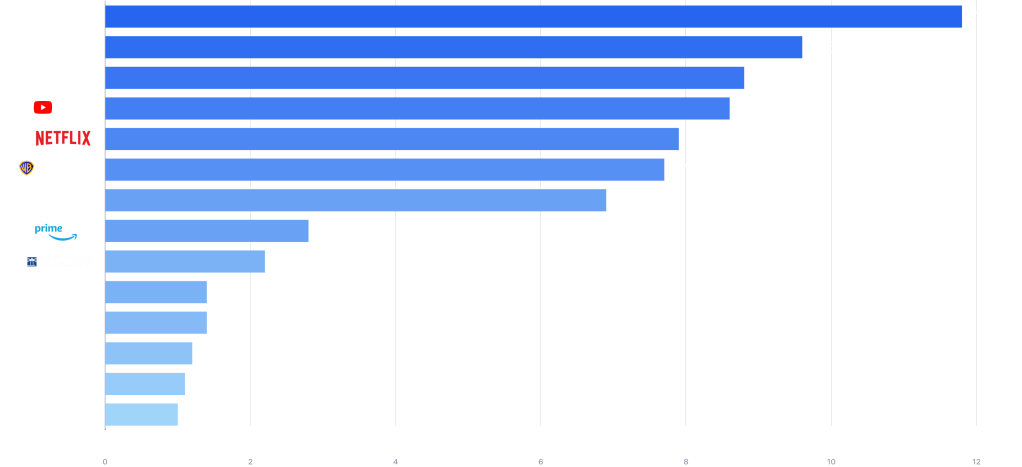
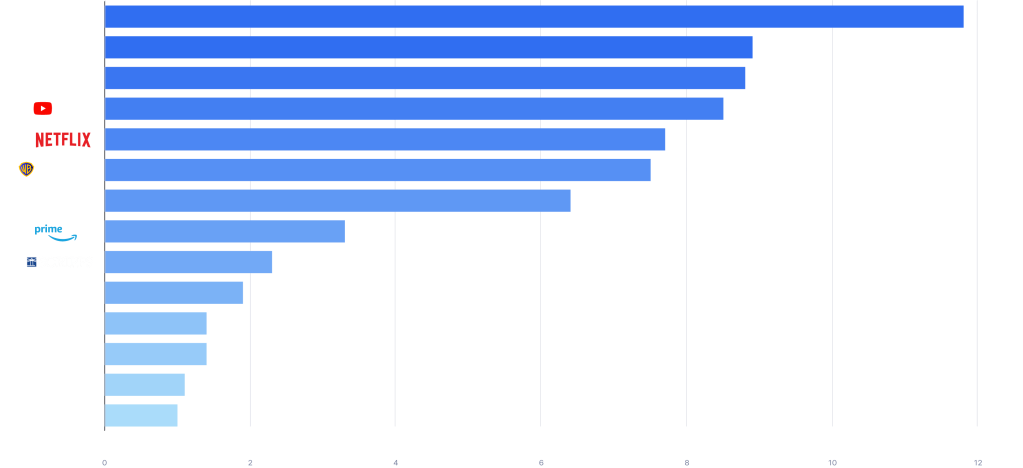
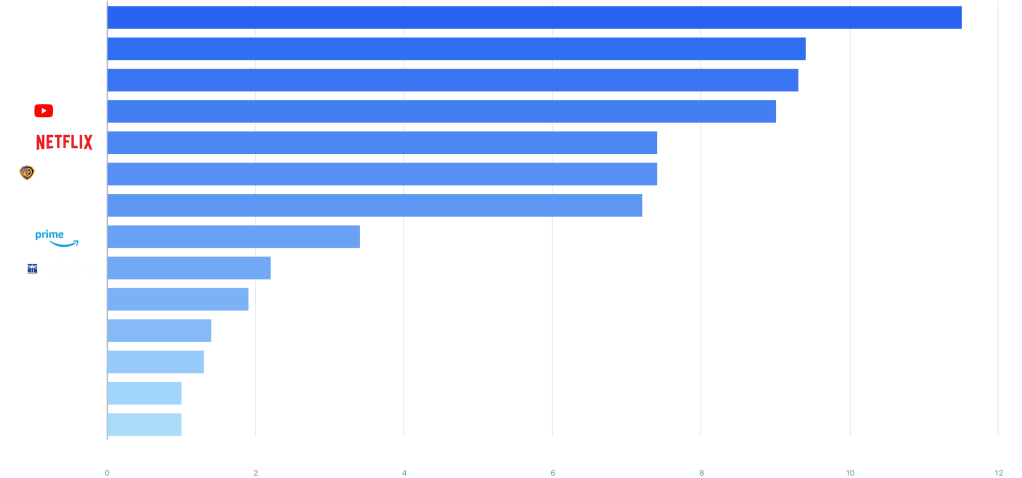
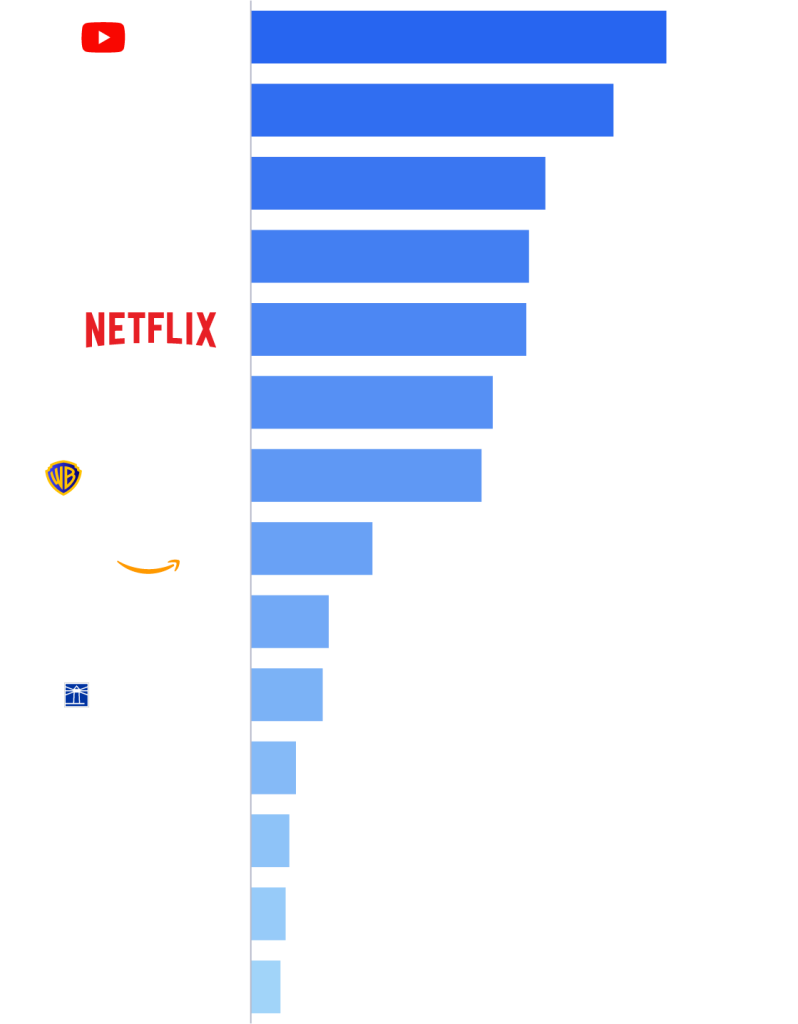
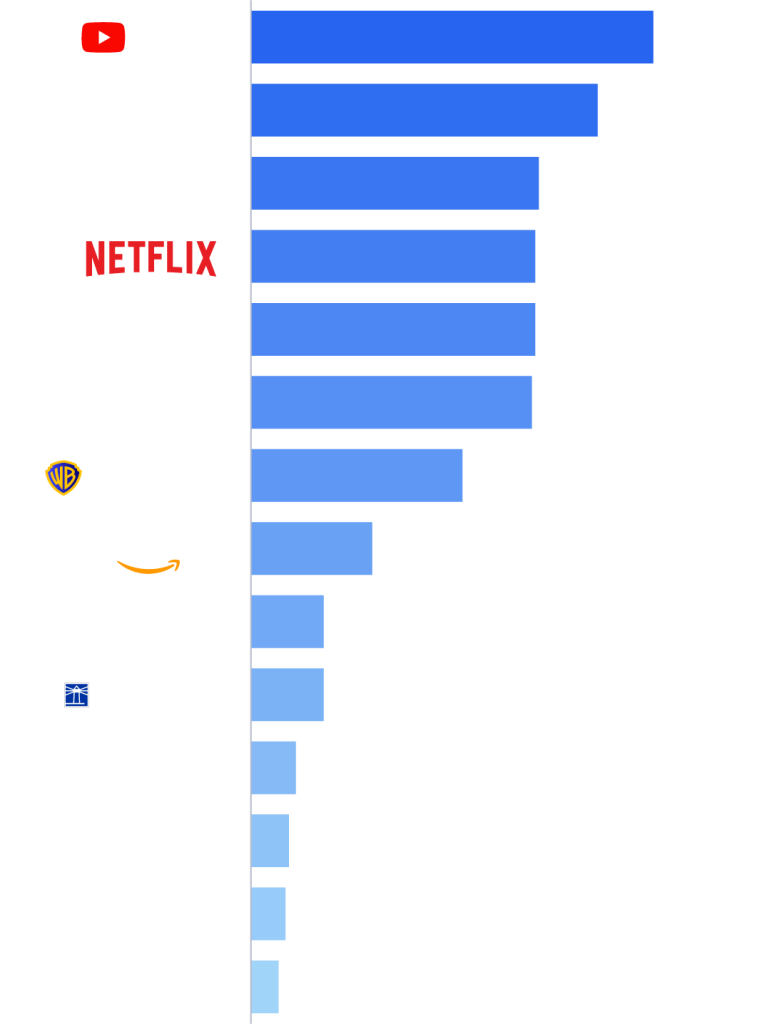


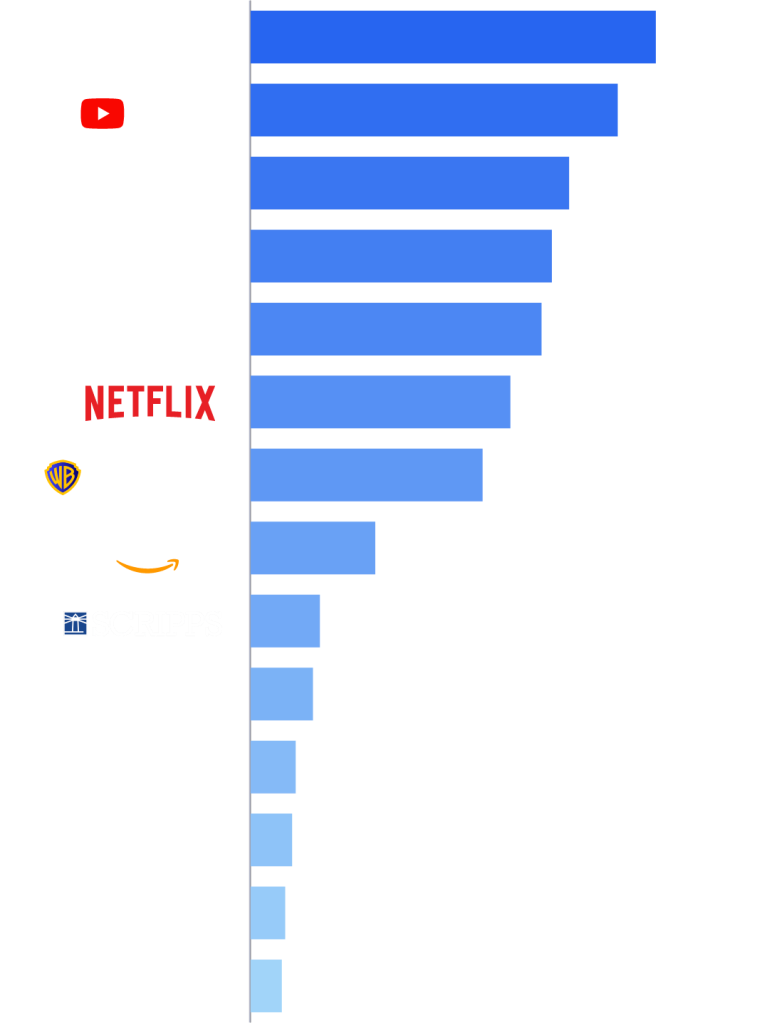
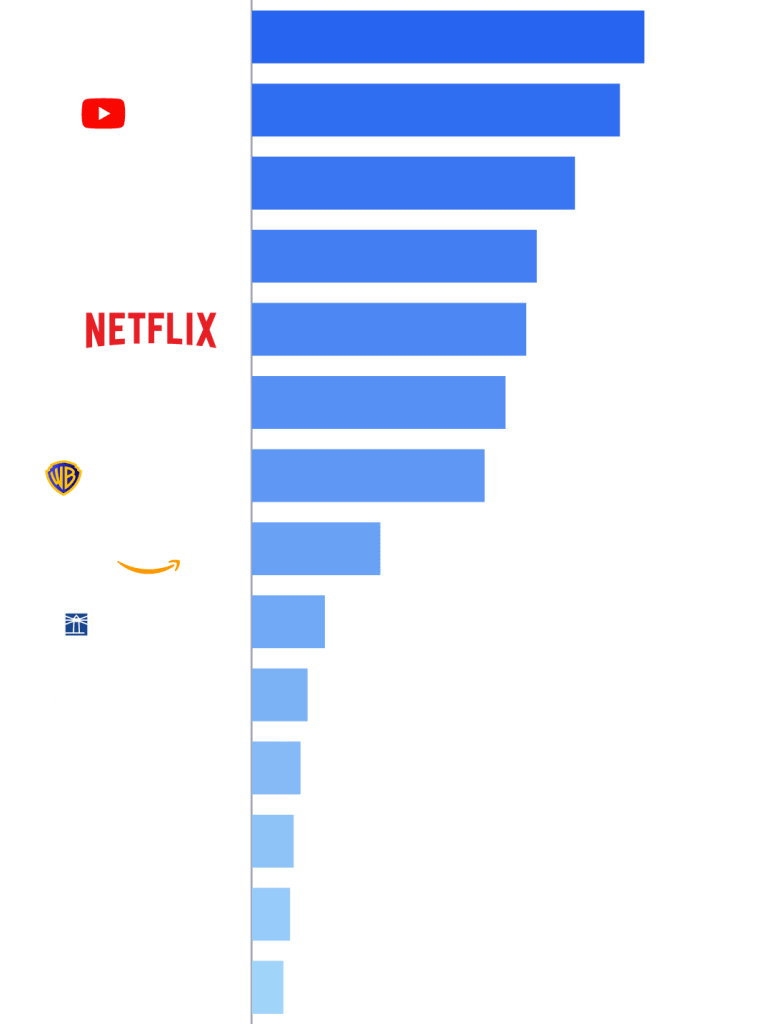
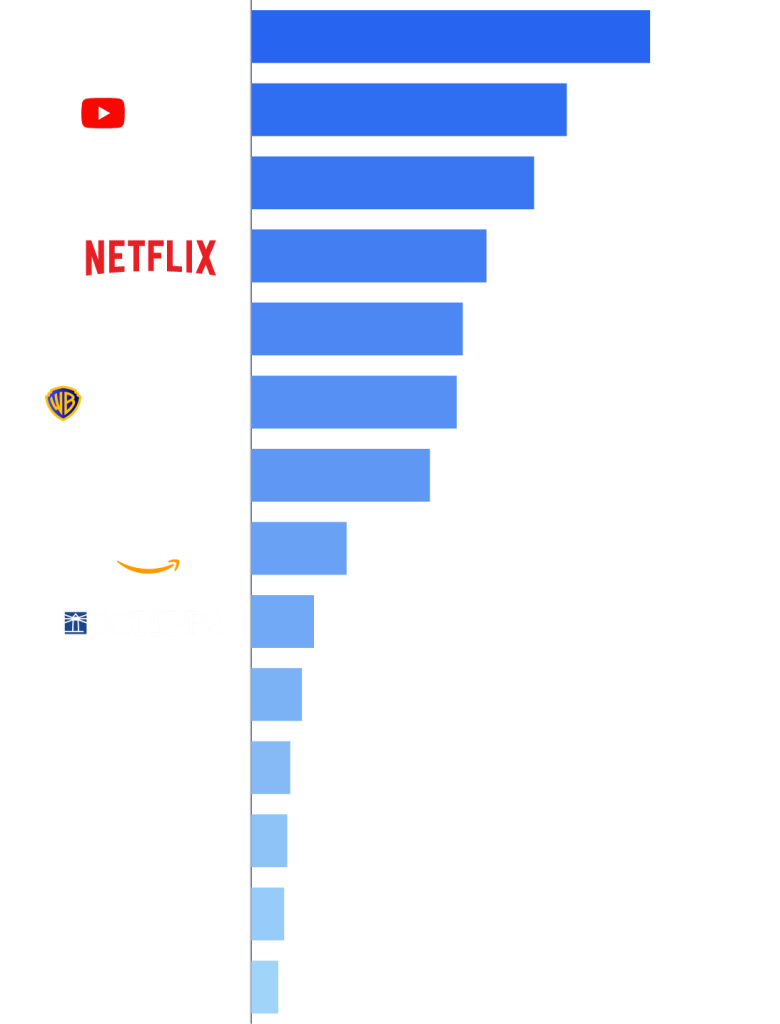
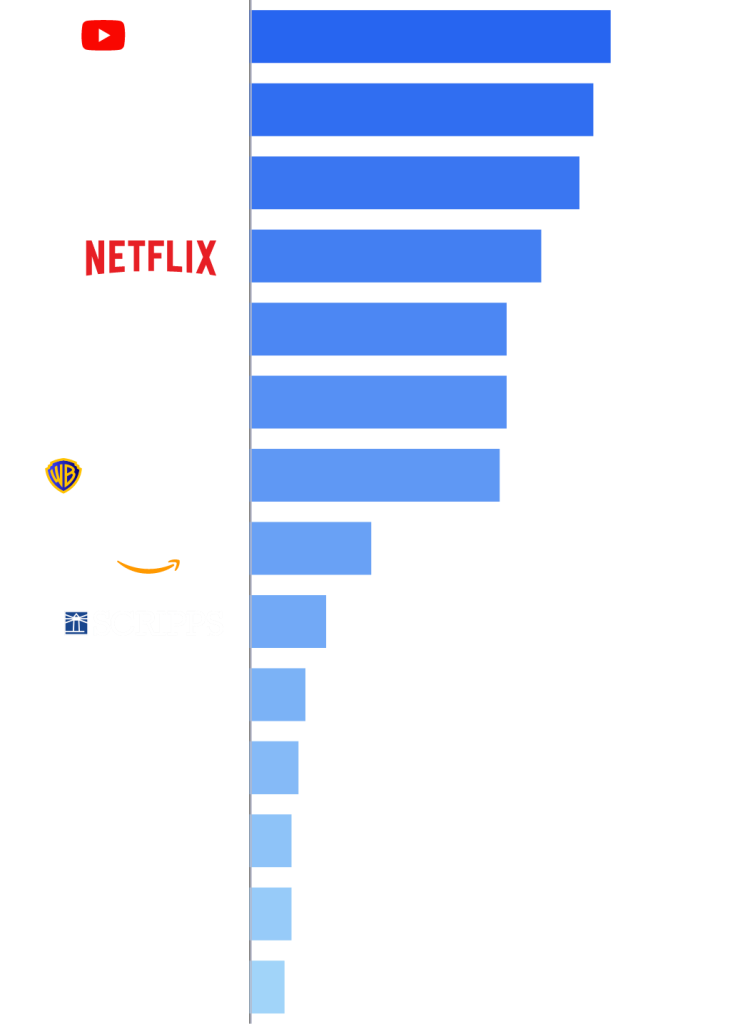
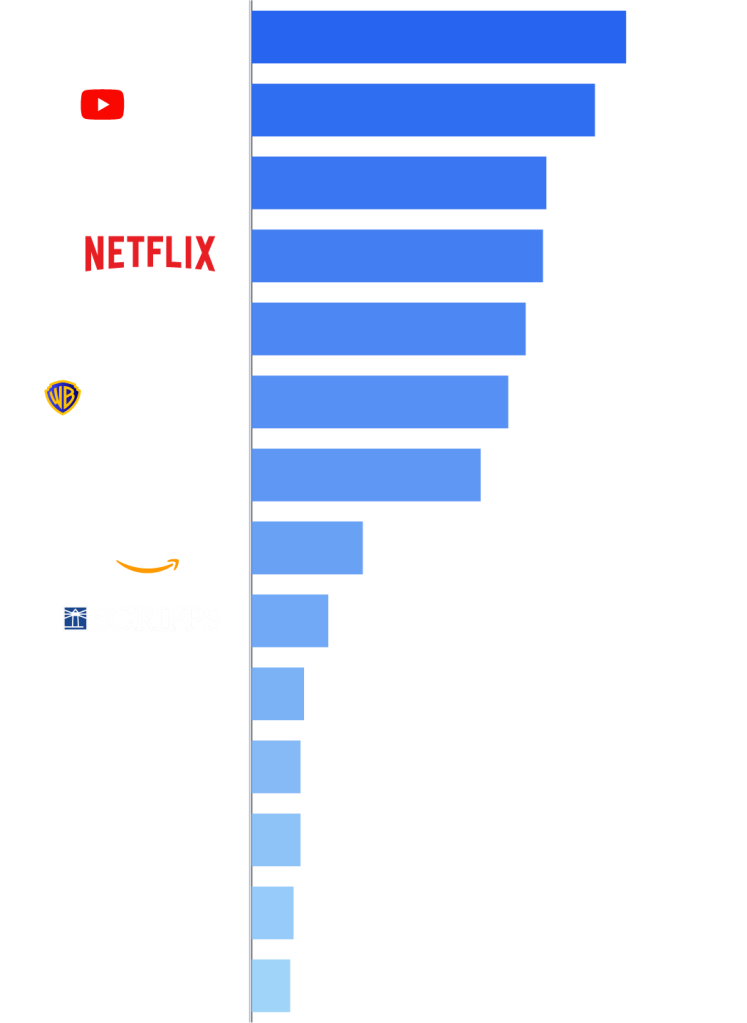
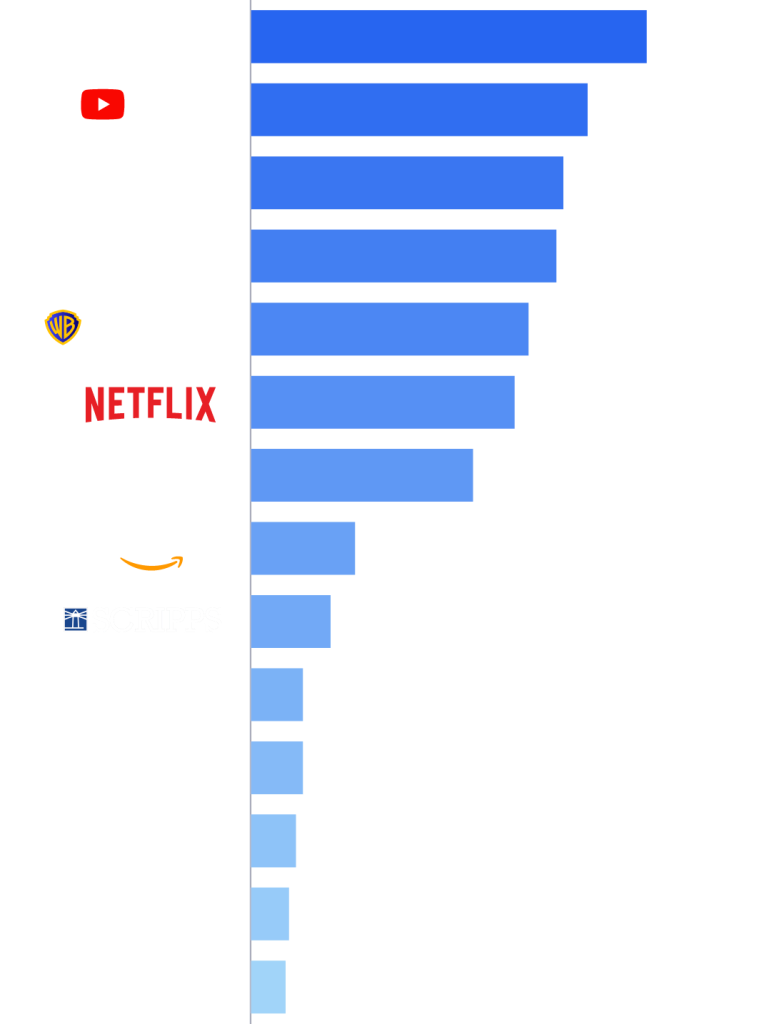
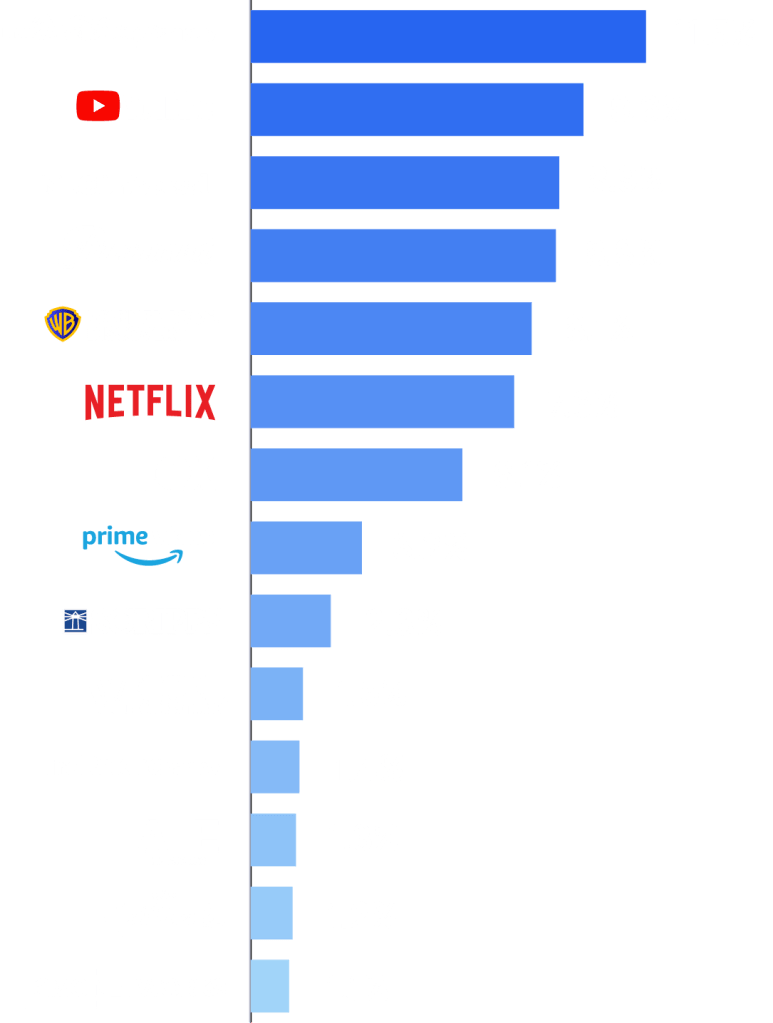
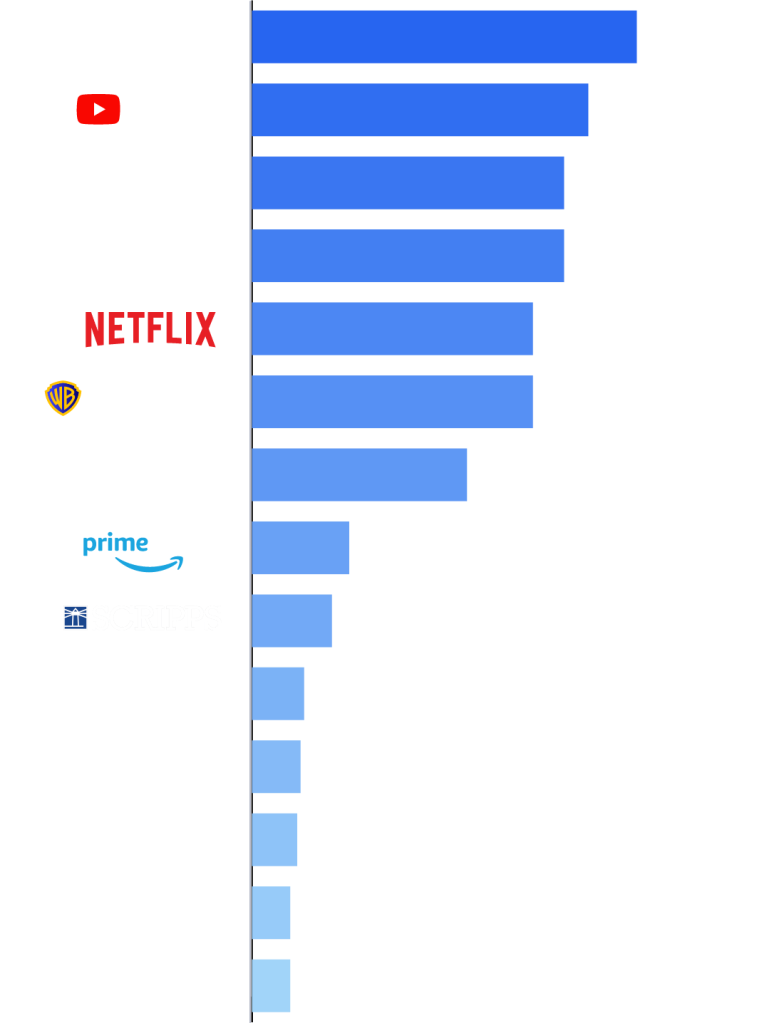
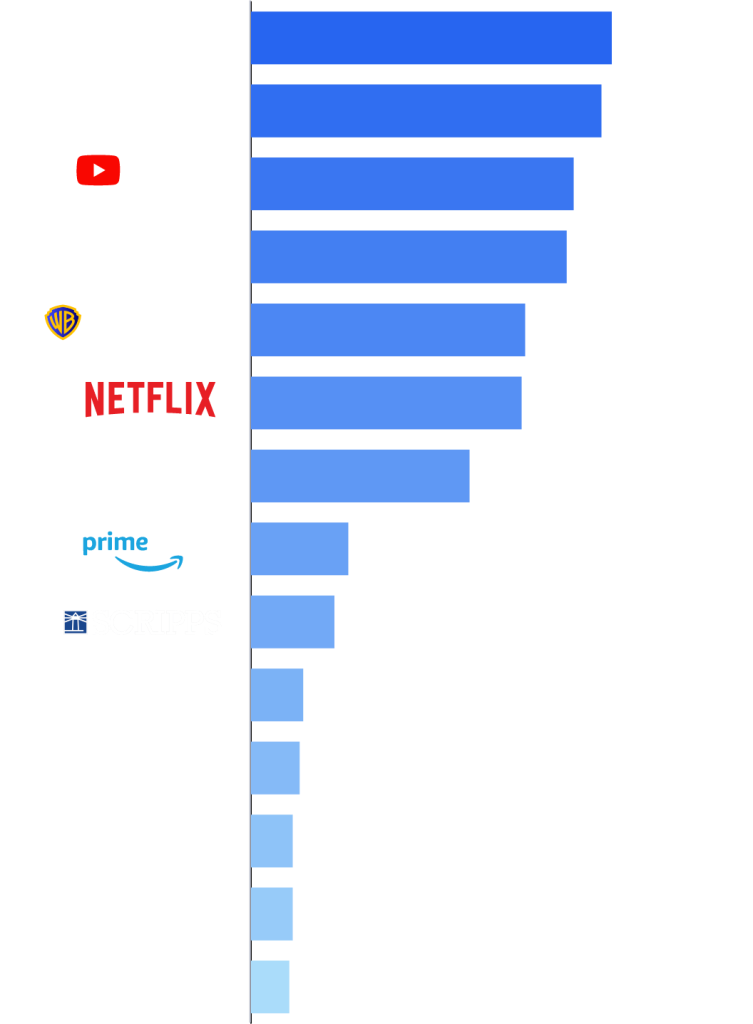
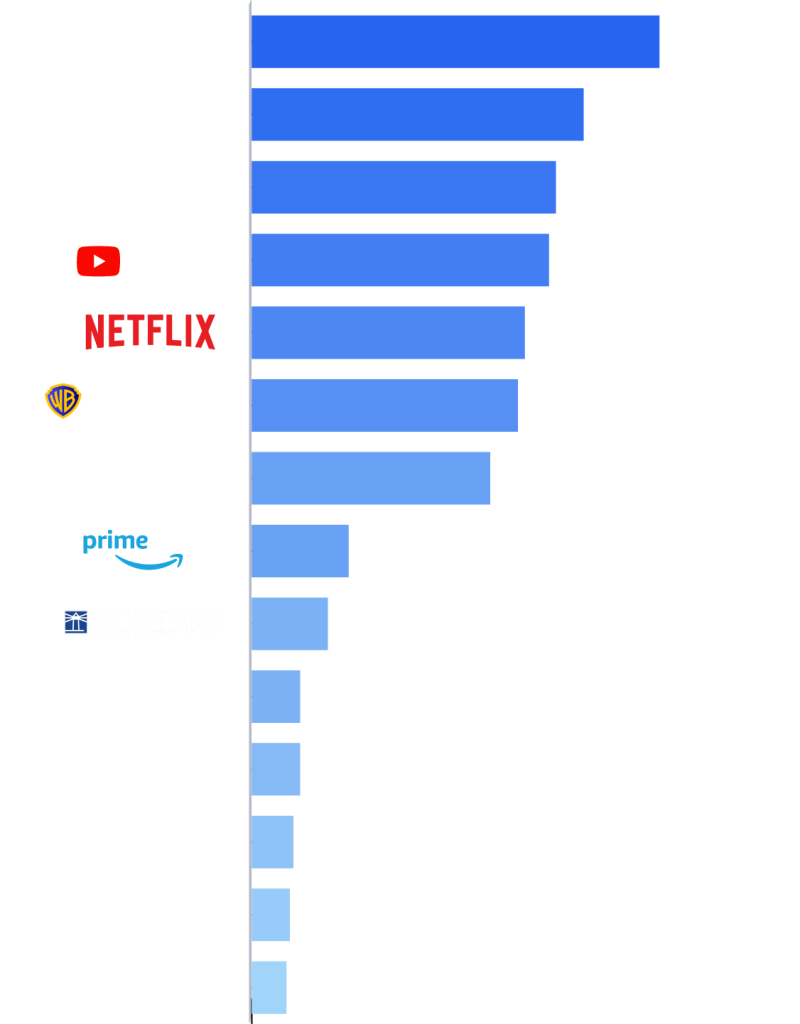
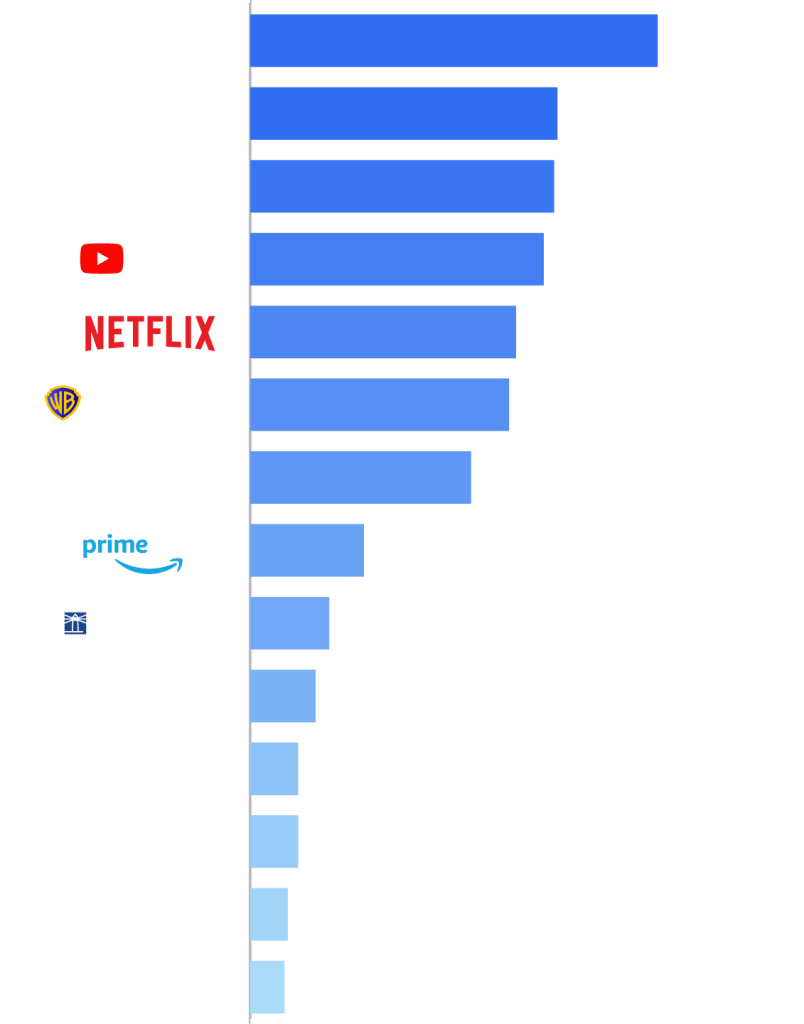
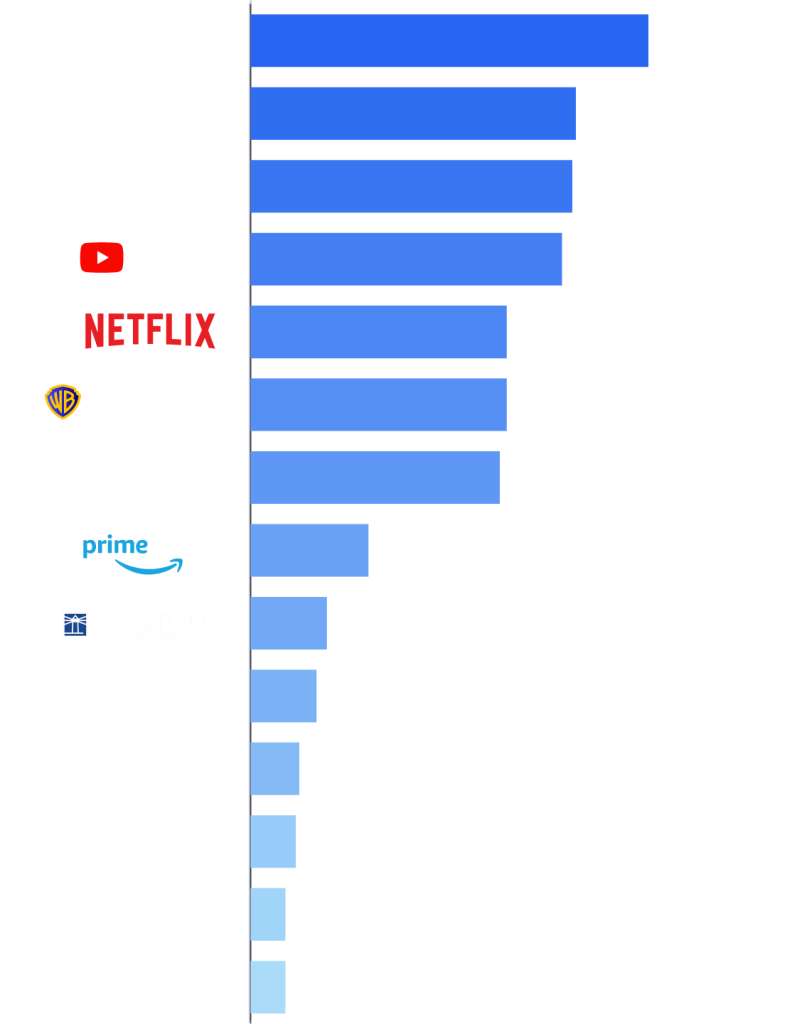
Copyright © 2025 The Nielsen Company (US), LLC. All Rights Reserved.
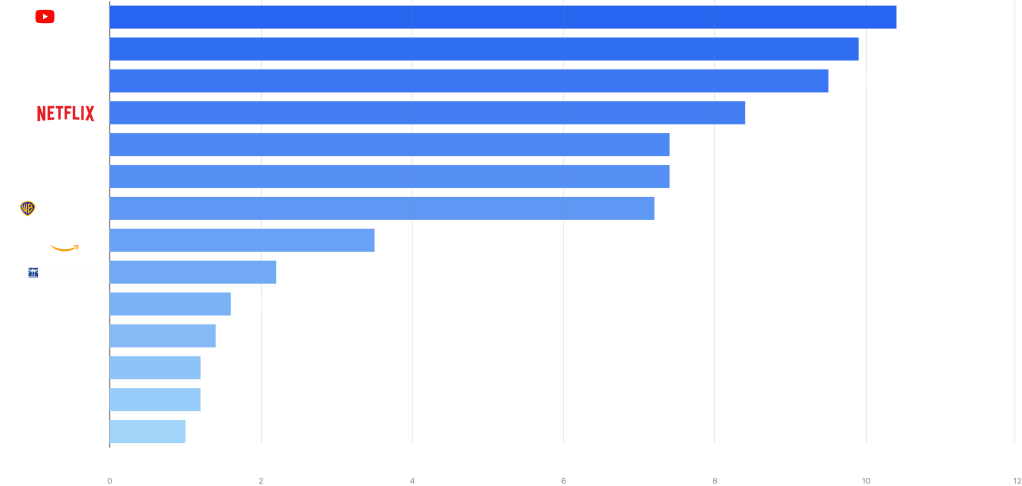
The Ad Supported Gauge
Quarterly share of Ad supported TV
Q1, 2025
Total day | Persons 2+
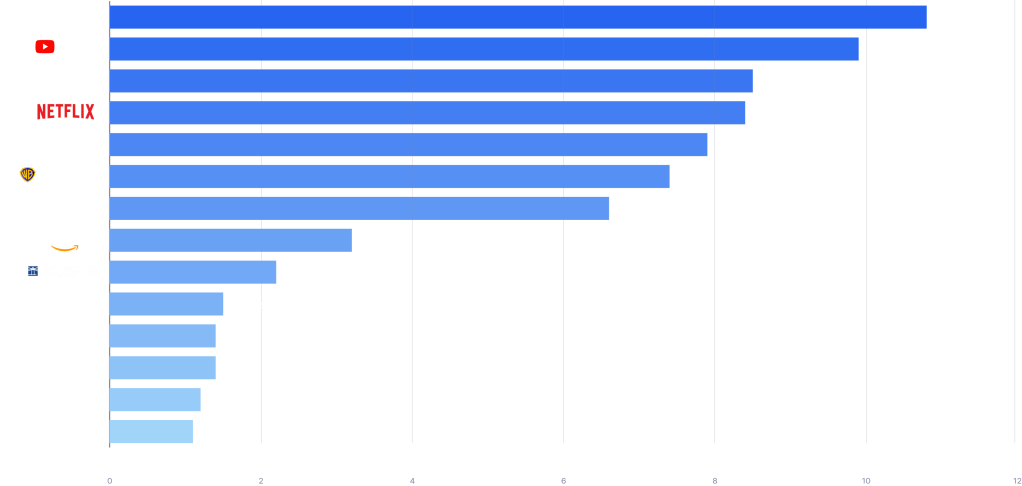
Ad Supported Share of TV
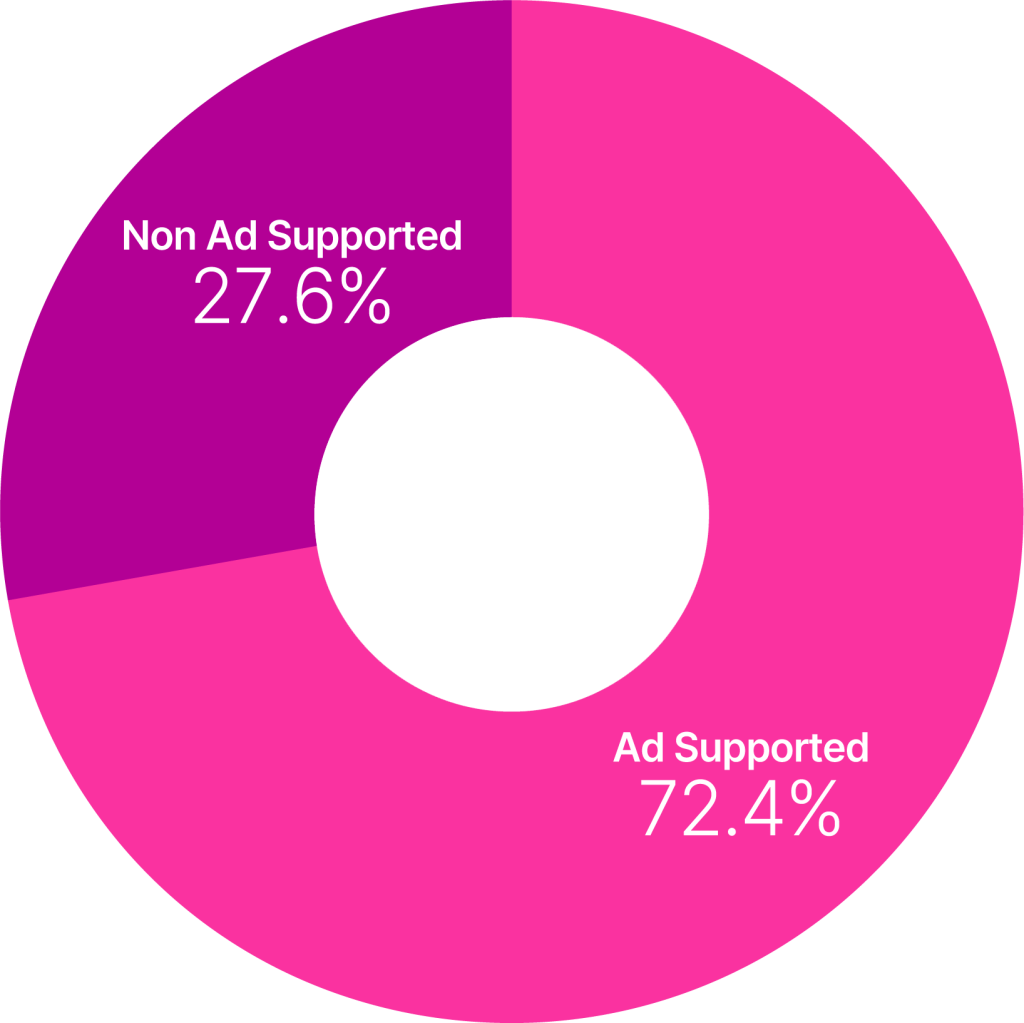
Q1, 2025
Total day | Persons 2+
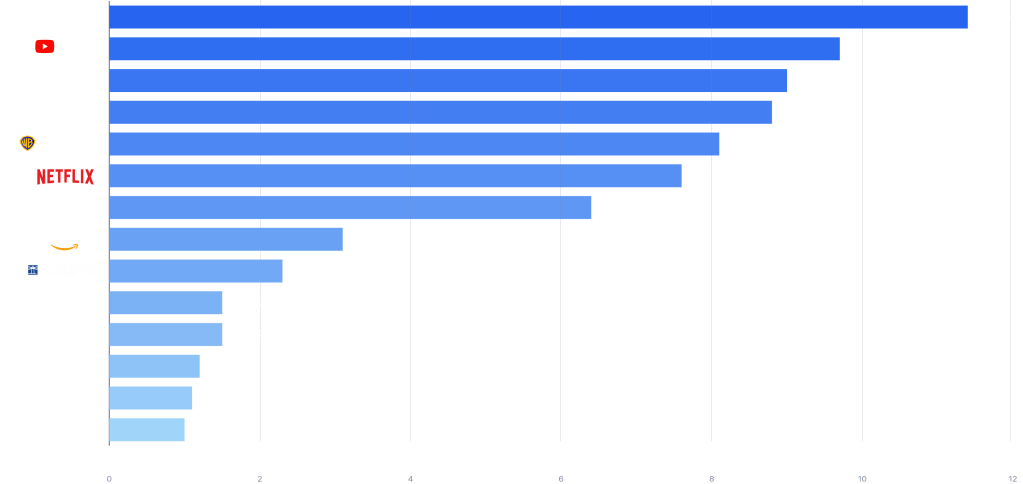
Category Share of Ad Supported TV
Copyright © 2025 The Nielsen Company (US), LLC. All Rights Reserved.

Looking for more data and trends?
Get the full picture now.
Methodology/FAQ
All your questions answered: The Gauge FAQ
- The data for The Gauge is derived from two separately weighted panels and combined to create the graphic. Nielsen’s streaming data is derived from a subset of Streaming Meter-enabled TV households within the National TV panel. The linear TV sources (broadcast and cable), as well as total usage are based on viewing from Nielsen’s overall TV panel.
- All the data is time period based for each viewing source. The data, representing a broadcast month, is based on Live+7 viewing for the reporting interval (Note: Live+7 includes live television viewing plus viewing up to seven days later for linear content).
- Within The Gauge, “other” includes all other TV usage that does not fall into the broadcast, cable or streaming categories. This primarily includes all other tuning (unmeasured sources), unmeasured video on demand (VOD), audio streaming, gaming and other device (DVD playback) use.
- Beginning with the June 2023 interval, Nielsen began utilizing Streaming Content Ratings to identify original content distributed by platforms reported in that service to reclassify content viewed via cable set top boxes. This viewing will credit to streaming and to the streaming platform which distributed it. It will also be removed from the other category, where it was previously reflected. Content not identified as original within Streaming Content Ratings and viewed through a cable set top box will still be included in other.
- Streaming platforms listed as “other streaming” includes any high-bandwidth video streaming on television that is not individually broken out. Apps designed to deliver live broadcast and cable (linear) programming (VMVPD or MVPD applications like Sling TV or Charter/Spectrum) are excluded from “other streaming.”
- Linear streaming (as defined by the aggregation of viewing to vMVPD/MVPD apps) is excluded from the streaming category as the broadcast and cable content viewed through these apps credits to its respective category. This methodological change was implemented with the February 2023 interval.
- Linear streaming via vMVPD apps (e.g., Hulu Live, YouTube TV) are excluded from the streaming category. ‘Hulu SVOD’ and ‘YouTube Main’ within the streaming category refer to the platforms’ usage without the inclusion of linear streaming.

Related Insights
Learn more about Americans’ media habits
-
Insights | 02-03-2026
The Black influence: How Black culture & identity drive the market
Now in its 15th year, data from the Black Diverse Intelligence Series underscores that cultural and economic…
-
-

Insights | 27-11-2025
Blind spots to bright spot: how Indian CMOs are winning with unified data
India’s advertising landscape is more fragmented—yet more critical—than ever before. Billions of…
-

Insights | 17-07-2025
Smarter Advertising for SMEs: Modal block with 3 CTA
Join our webinar Smarter Advertising for SMEs: Data-driven Strategies to grow your business. Are you tired…
Our products can help you and your business
-

Streaming Signals
Plan and optimize real-time ad insertions across streaming and connected TV advertising more efficiently with…
-

Streaming Content Ratings
Uncover the viewing habits of streaming audiences to gain a more comprehensive view of your video content’s…