Don Kellogg, Director, Telecom Research & Insights, Nielsen
When consumers use their mobile phones to check the news, weather, email, or their social networks, they often have a choice between the mobile web version or a specially-created mobile app. But which do they prefer? Mobile apps – at least in terms of time spent.
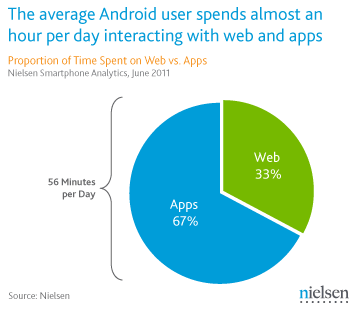
According to first-reported data from Nielsen Smartphone Analytics, a new effort that tracks and analyzes data from on-device meters installed on thousands of iOS and Android smartphones, the average Android consumer in the U.S. spends 56 minutes per day actively interacting with the web and apps on their phone. Of that time, two-thirds is spent on mobile apps while one-third is spent on the mobile web.

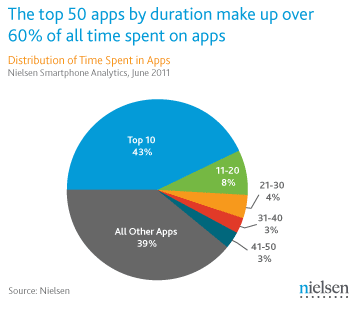
Perhaps more surprising, despite the hundreds of thousands of apps available for Android, a very small proportion of apps make up the vast majority of time spent. In fact, the top 10 Android apps account for 43 percent of all the time spent by Android consumers on mobile apps. The top 50 apps account for 61 percent of all time spent. With 250,000+ Android apps available at the time of this writing, that means the remaining 249,950+ apps have to compete for the remaining 39 percent of the pie.

- For more Android insights, join us for our free webinar, All About Android on September 15.


