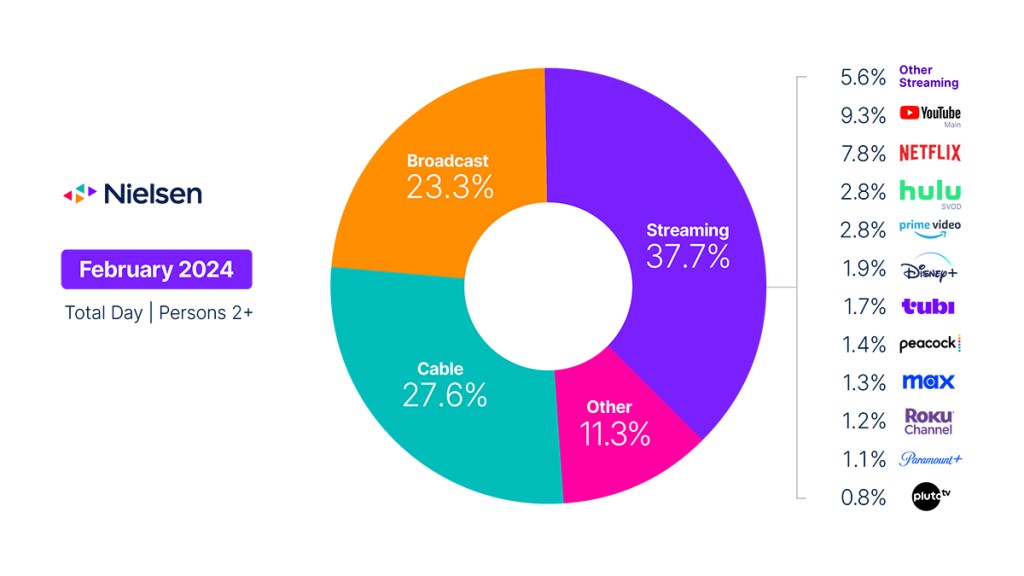
Total TV usage dipped in February; streaming usage climbed to 37.7% of TV
In seasonal fashion, TV usage declined in February following the end of the NFL playoffs. While Super Bowl LVIII was a standout that attracted 123.7 million viewers, the 6.4% dip in viewership for the month was considerably larger than it was in the previous two years (5.7% and 5.1%, respectively). This fact, however, is more of a testament to how strong viewing was in January 2024 than in the previous two years.
In addition to attracting the largest TV audience on record, the Super Bowl played a big role in making Feb. 11, 2024, the day with the most TV viewing since The Gauge was launched in May 2021. In total, the game delivered 30 billion viewing minutes—5 billion more than last year’s game. Going into overtime, however, did contribute here.
Outside of the action around the Super Bowl, broadcast viewing receded following its climb into January, with viewing down 10% overall. The sports genre was a major factor in its decline, as sports viewing dropped 66% in the wake of the NFL playoffs. On a year-over-year basis, the overall drop in broadcast viewing is in line with last year’s 9.2% decline. With some new content in rotation, however, the drama category gained momentum to command 26% of broadcast viewing in February. With all eyes on the Super Bowl in February, CBS used the big game to get audiences excited for its new season, featuring Tracker, NCIS, FBI and the final season of Young Sheldon.
Across cable, news viewing increased 7% as audiences tuned in to election year coverage, while sports viewing was down by about one-third. Even without as many sports events, the sports genre still delivered the top programs for cable, with the 2024 NBA All-Star Game simulcast on TNT, TBS and TruTV taking the top slot, followed by the NBA All-Star Saturday Night on TNT and TruTV.
TV viewing typically starts to decline as the spring season approaches. This seasonality affects all TV viewing, but it had less of an impact on streaming in February than the other categories. As a result, streaming usage dipped 1.9%, but the category was able to gain 1.7 share points to account for 37.7% of TV usage, its largest share of total TV since August 2023. It’s also 3.4 share points above February 2023.
As we’re not yet seeing a consistent release of new titles, acquired titles continued to attract the most viewership, with Young Sheldon (Netflix, Max) topping the rankings with 4.6 billion viewing minutes, followed by Bluey (Disney+) with 4.5 billion and Grey’s Anatomy (Netflix) with 3.5 billion. Netflix’s Griselda added some new content to the rankings, coming in fourth with 3.2 billion.
As it does for the broadcast and cable categories, sports has started to make a mark in the streaming category when high-profile events are shown. After gaining in January as a result of its exclusive NFL Wildcard game, Peacock usage dropped 19%, while Paramount+ gained 24% in February as a result of its simultaneous carriage of the Super Bowl alongside CBS. Both platforms have also benefited from the appeal of new original programming, namely Ted and the Traitors on Peacock (1.3 billion minutes combined) and Halo on Paramount+, accounting for 1.2 billion viewing minutes.
February was also a big month for FAST services, as Pluto TV, Tubi and the Roku Channel experienced gains of 10%, 8.3% and 8.1%, respectively. YouTube also posted a platform-best share in February, capturing 9.3% of total TV usage.

February data trends with Brian Fuhrer
Methodology and frequently asked questions
How is ‘The Gauge’ created?
The data for The Gauge is derived from two separately weighted panels and combined to create the graphic. Nielsen’s streaming data is derived from a subset of Streaming Meter-enabled TV households within the National TV panel. The linear TV sources (broadcast and cable), as well as total usage are based on viewing from Nielsen’s overall TV panel.
All the data is time period based for each viewing source. The data, representing a broadcast month, is based on Live+7 viewing for the reporting interval (Note: Live+7 includes live television viewing plus viewing up to seven days later for linear content).
What is included in “other”?
Within The Gauge, “other” includes all other TV usage that does not fall into the broadcast, cable or streaming categories. This primarily includes all other tuning (unmeasured sources), unmeasured video on demand (VOD), audio streaming, gaming and other device (DVD playback) use.
Beginning with the May 2023 interval, Nielsen began utilizing Streaming Content Ratings to identify original content distributed by platforms reported in that service to reclassify content viewed via cable set top boxes. This viewing will credit to streaming and to the streaming platform which distributed it. It will also be removed from the other category, where it was previously reflected. Content not identified as original within Streaming Content Ratings and viewed through a cable set top box will still be included in other.
What is included in “other streaming”?
Streaming platforms listed as “other streaming” includes any high-bandwidth video streaming on television that is not individually broken out. Apps designed to deliver live broadcast and cable (linear) programming (vMVPD or MVPD applications like Sling TV or Charter/Spectrum) are excluded from “other streaming.”
Where does linear streaming contribute?
Linear streaming (as defined by the aggregation of viewing to vMVPD/MVPD apps) is excluded from the streaming category as the broadcast and cable content viewed through these apps credits to its respective category. This methodological change was implemented with the February 2023 interval.
What about live streaming on Hulu and YouTube?
Linear streaming via vMVPD apps (e.g., Hulu Live, YouTube TV) are excluded from the streaming category. ‘Hulu SVOD’ and ‘YouTube Main’ within the streaming category refer to the platforms’ usage without the inclusion of linear streaming.


