In our recent examinations of TV, radio and digital usage, we have explored the use of comparable metrics and have analyzed patterns of usage throughout the day. In this report, we build on both by using comparable metrics and patterns of usage to analyze the effect of income on device ownership and media use.
The proportion of usage going to each media platform is partly explained by the ownership of new devices and services, and partly by the ways adults with different incomes use these devices and services. Not surprisingly, higher-income households own more different kinds of media devices and subscribe to more services. This is particularly evident with newer devices and services such as smart TVs, multimedia devices, tablets and SVOD.
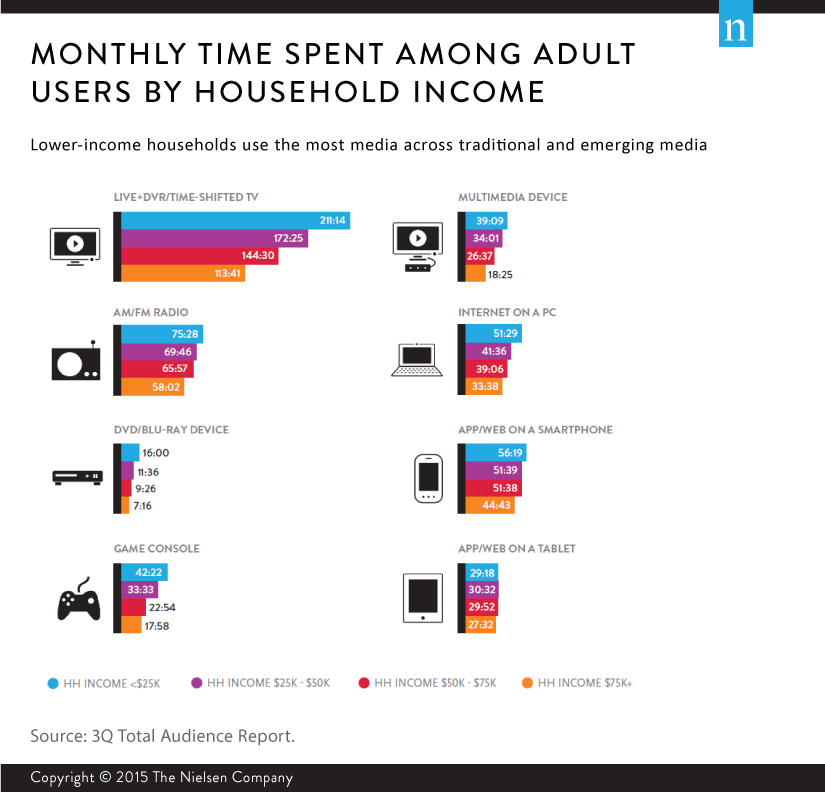
Monthly Time Spent by Household Income
The most interesting finding on the usage side is that users in lower-income households spend more time with every device that they use than high-income households. This is true not just of traditional devices, but of newer ones as well.


