Smartphones and apps go together about as good as peanut butter and jelly. In fact, as the ubiquity, utility and ease of use of smartphones continues to increase in the U.S., it comes as no surprise that app development and usage is following suit. According to Nielsen Mobile Insights, smartphone penetration across the total U.S population for adults 18+ increased to 74% (81% of mobile subscribers) in Q4 2015. With several million apps now available in the U.S., and more being released every day, apps provide seemingly endless options for busy, mobile consumers.
In fourth-quarter 2015, smartphone owners used an average of 27.1 different apps per month. Despite rapid evolution throughout the marketplace, including new apps, additional device functionality and broadened device capabilities, the number of apps used has remained relatively stable since the end of 2012.
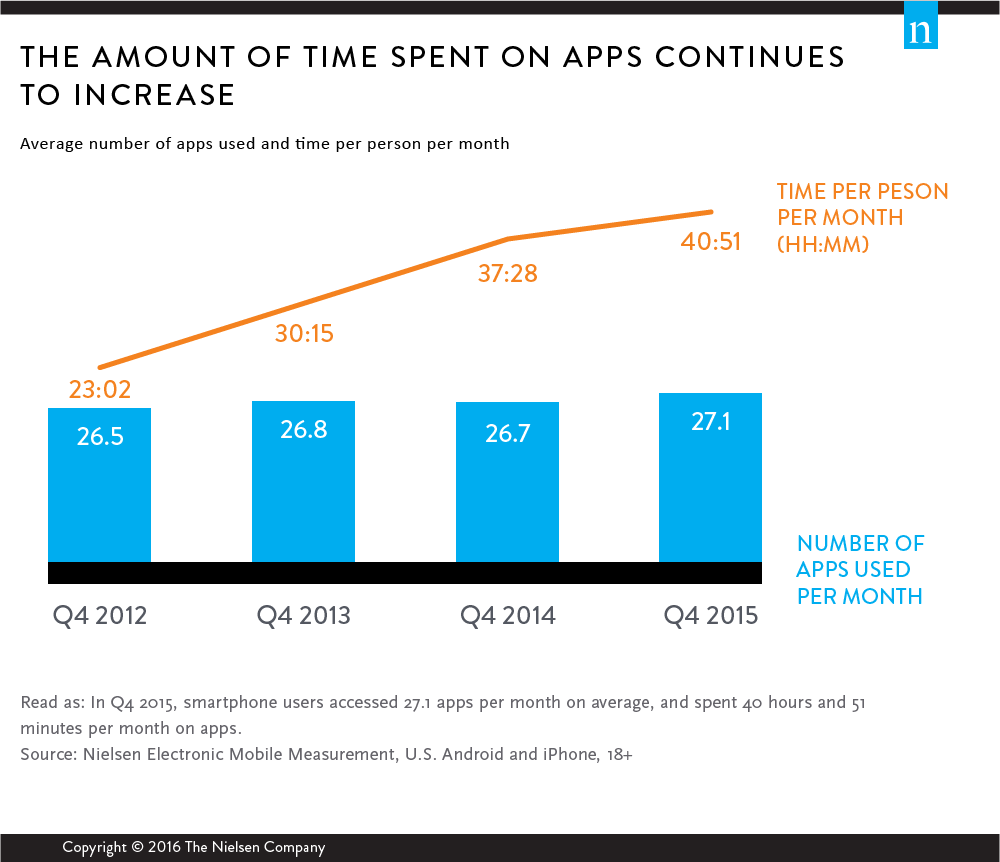
While there appears to be a limit to the total number of apps people actively use each month, the time they spend engaging with those apps continues to grow steadily. Since fourth-quarter 2012, the time spent per person each month has jumped from just over 23 hours to almost 41 hours, an increase of 77%! The average time spent per app has also grown during the period, increasing from 52 minutes in fourth-quarter 2012 to one-and-a-half hours in fourth-quarter 2015.
Nielsen’s recent study also found differences in the way men and women use their apps. Overall, women use slightly more apps per month than men do, and they spend almost three more hours using them. The average time spent per app, however, is relatively even for men and women (1:33 for females and 1:27 for males).
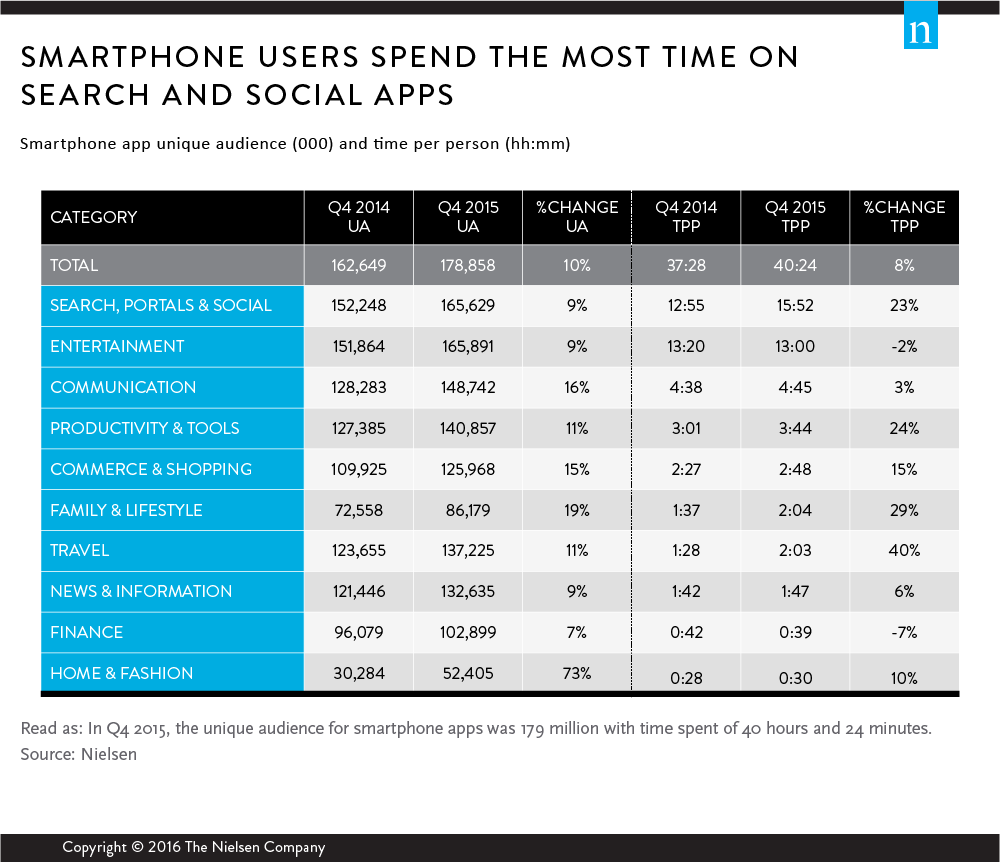
Home and fashion apps saw the highest increase (73%) in unique audience between fourth-quarter 2014 and fourth-quarter 2015, growing from 30.2 million to 52.4 million. Travel apps saw the highest increase in time spent, increasing 40% from 1 hour and 28 minutes per person to 2 hours and 3 minutes during the period. Entertainment and search, portals, and social networking are the largest app categories, with more than 165 million unique users each. Mobile commerce has also gained in popularity, as the commerce and shopping category eclipsed 125 million users who averaged 2 hours and 48 minutes per person throughout the holiday season in fourth-quarter 2015.
When it comes to age, smartphone users between the ages of 25 and 49 are most likely to access a variety of apps, but the heaviest users by times spent skew slightly younger. Millennials age 18-24 access relatively fewer apps (25.6), but spend nearly two full days per month using them, while users 25-34 spend 46:31 on 28.2 apps.
Methodology
Insights about mobile app usage were gathered using Mobile NetView 3.0, Nielsen’s on-device software, which is installed with permission on panelist smartphones (approximately 9,000 panelists ages 18+ with Android and iOS handsets). The panelists are recruited online in English and include Hispanic, African-American and Asian-American consumer representation.