One of the biggest challenges facing media consumers today is finding something to watch or listen to. Can that be right? After all, we live in a time where thousands of content choices are merely a click or swipe away.
As hard as it is to fathom, it’s not uncommon for scenarios of indecision to play out, but that’s because we spend quite a bit of time checking out previews, trailers, teasers, schedules and listings, yet struggle to land on something that actually engages us.
But this isn’t just tragic for consumers. It has just as much of a negative effect on content creators, programmers, platforms and marketers. After all, if their efforts fail, consumers spend more time searching and less time consuming.
So with so much choice available, how are modern consumers navigating the “paradox of choice” and deciding what to watch? Are they embracing subscription and on-demand services, or relying on traditional means like live scheduled programs and DVR?
Surprisingly, findings from the first-quarter Nielsen Total Audience Report suggest that it might be the latter, as streaming users tend to gravitate back toward their traditional TV preferences when they’re not sure what to watch. Still, seven in 10 homes have a subscription video on demand (SVOD) service and 72% use streaming-capable TV devices, putting the onus on streaming services to keep users engaged with the content on their increasingly accessible platforms.

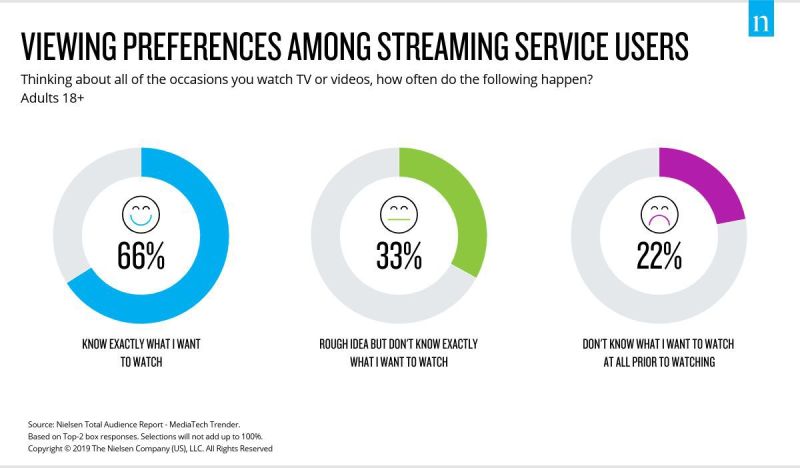
When we look at video streamers, Americans are pretty focused. Notably, our MediaTech Trender survey found that on all of the occasions they stream TV or video, almost two-thirds of adults who stream video content are likely to watch when know exactly what they want. One-third will watch when they have a rough idea, and only 22% watch when they don’t know what they want before diving into the options.
For those who are still on the fence about what to watch, it gets a bit tricky when looking at how they make their choices.

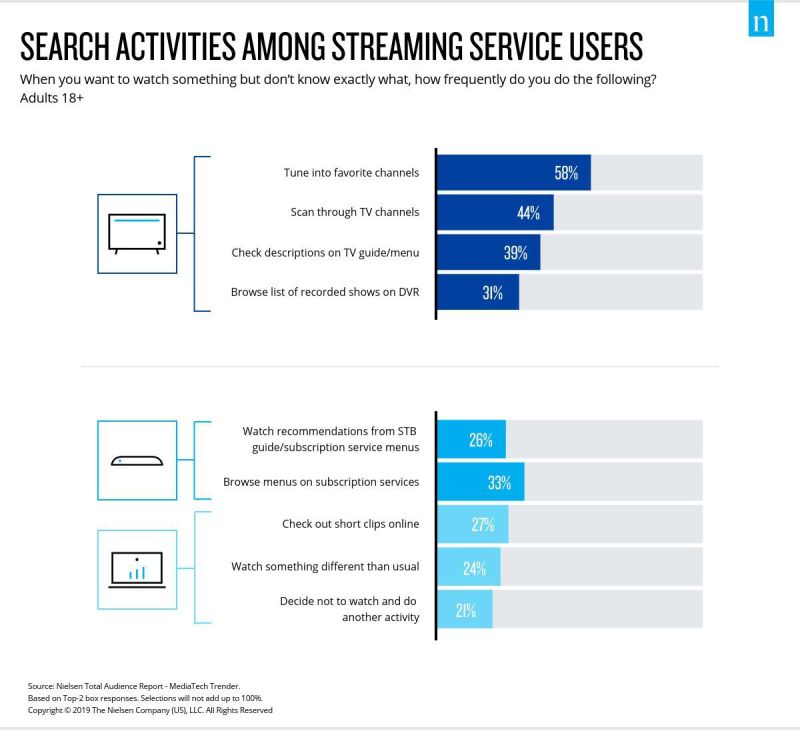
The interesting thing about video streamers is that they’re frequent “go-backers.” Said differently, they like what they know and are comfortable with. In fact, 58% say they go back to their favorite traditional channels, 44% like to scan through traditional channel options, 39% scan the program listings and 31% browse their DVR recordings.
Comparatively, far fewer SVOD users scan their subscription content menus. That means SVOD content creators, programmers, platforms and marketers have some work to do in terms of giving viewers what they’re looking for. The data shows it. Only one-third of adult respondents say they browse their SVOD content menus for more content, while 21% say they would simply not watch anymore content altogether.
The Curious Case of the Core Demo
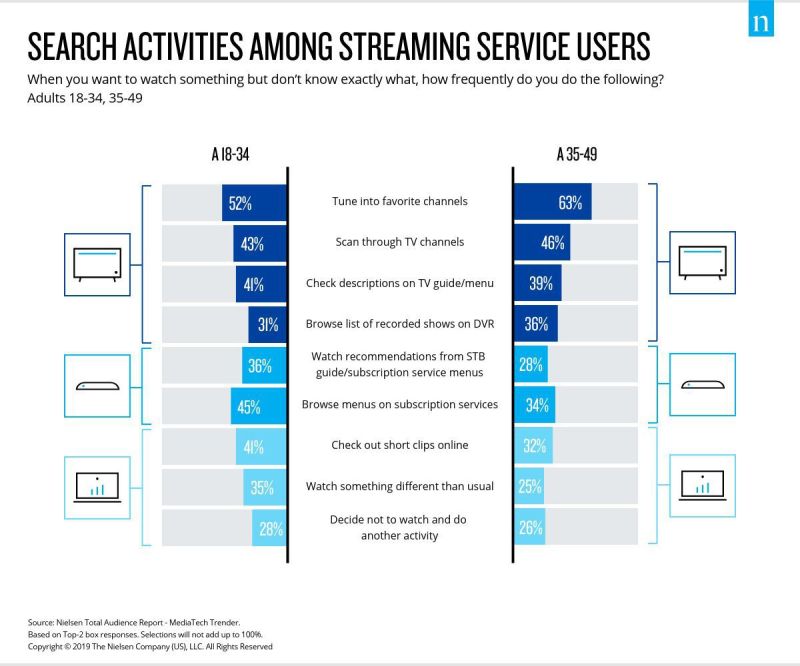
So which group is most susceptible to indecision? The group that marketers cover the most: the 18-49-year-olds.
Comparatively, younger adults are more likely to explore. They’ll flip through menus, check out programs that have been recommended for them and step outside their traditional content comfort zones. But they also tend to rely on another “extreme” route, as they reported to tune out all together at higher levels compared to other demos.

So how long do people dwell on their content options? On average, a notable 9.4 minutes was reported for adults 18-34 and 8.4 minutes for adults 35-49 who stream. Think about how much more engagement content providers and platforms could achieve if they took out the guesswork. And if they did that, they’d have better retention rates. That’s because nearly 30% of streaming adults 18-49 said they sometimes stop watching content if they can’t find something appealing.
Being inundated by choice is not particularly new to the world of content. Traditional television has faced similar issues for decades. But for the new players in the game, refining recommendations and creating menus and user experiences to better suit user tastes might be their best way to combat it.
NOtes
- Click here for more information about the Q1 2019 Nielsen Total Audience Report.
- Click here to purchase the Q1 2019 Total Audience Report.


