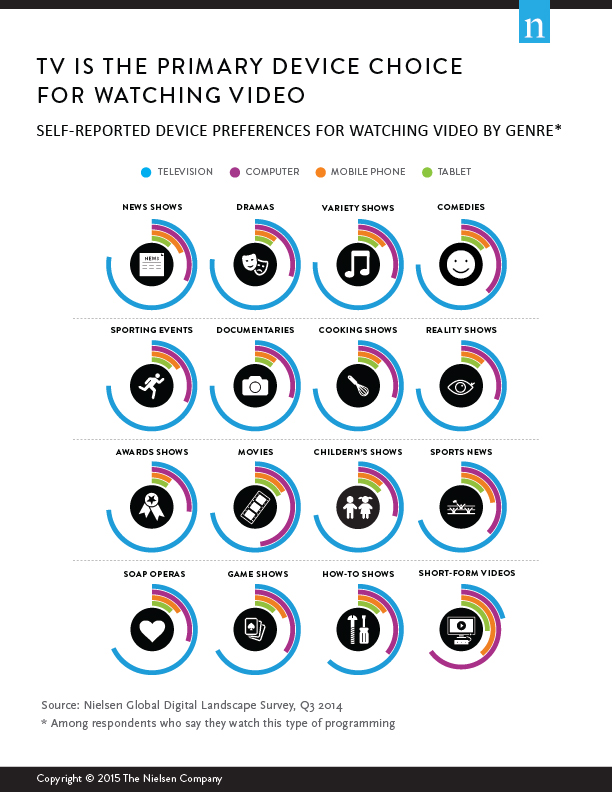
What’s your go-to device of choice for watching your favorite show? While device proliferation has afforded more choice than ever before, the TV screen is still top for nearly all forms of video content. Whether we’re watching a sporting event, news show, documentary or movie, TV remains the preferred device—and by a wide margin according to global online respondents in Nielsen’s Digital Landscape Survey.
The only exception to the rule: short-form video (typically less than 10 minutes long). Audiences more commonly view bite-sized content on computers, mobile phones and tablets. In fact, a computer is the second-most commonly mentioned viewing device for nearly all genres, and it tops the list of devices used to watch short-form content. A smaller, but notable, proportion of consumers watch video content on a mobile phone or tablet, while viewing on e-readers and/or gaming consoles has not yet gained traction.

Generationally, TV is the primary device of choice for viewing video across all segments, but its leadership status is highest among older consumers. Computer and mobile phone use, on the other hand, is highest among the youngest consumers. More than four-in-10 Generation Z and Millennial respondents (42% each) say they watch video programming on a computer, compared with 31% of Generation X, 25% of Baby Boomer and 15% of Silent Generation respondents. Similarly, one-fifth of Millennial and Generation Z respondents (22% and 20%, respectively) say they watch on a mobile phone, compared with 14% of Generation X, 6% of Baby Boomer and 2% of Silent Generation respondents. Tablet use is also highest among Millennial and Generation X respondents, cited by 16% and 15% of respondents, respectively. In comparison, 12% of Generation Z, 8% of Baby Boomer and 4% of Silent Generation respondents say they watch video on a tablet.
Where We Watch
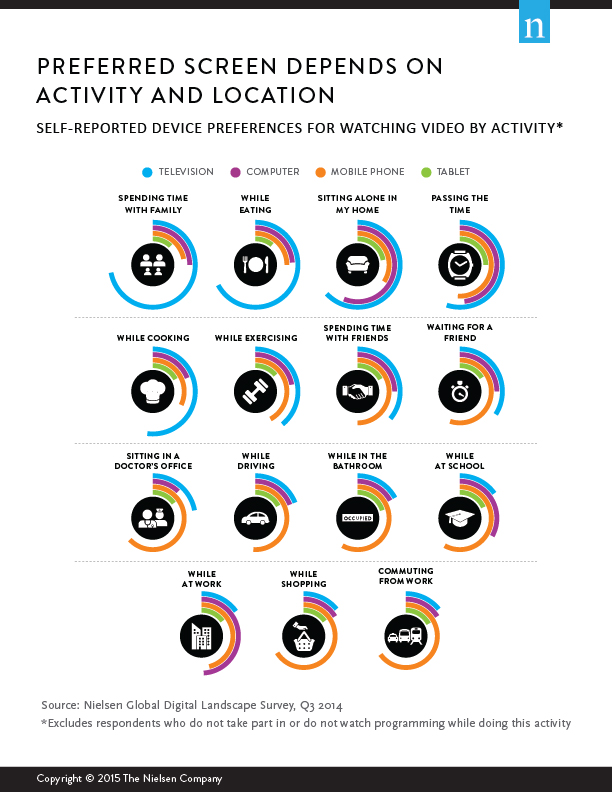
While TV remains the primary device of choice for watching videos in the home, mobile phones are the most commonly cited go-to device for on-the-go viewing. But device viewing is largely situational, depending on where we are, whom we’re with and what we’re doing. Even at home, the traditional TV may not automatically be the go-to device. For example, among respondents who watch video programming when they’re home alone, the largest percentage (63%) say they watch video programming on the TV, but the computer is a relatively close second cited by 56% of global respondents. In addition, 34% say they use a mobile phone, and 22% turn to a tablet to watch video programming while alone.
“The lines between devices continue to blur, and the best available screen for viewing may vary widely as viewers move through the day,” said Megan Clarken, executive vice president, Nielsen Global Watch Product Leadership. “Audiences will choose the device that is most compatible with their needs at the time they want to watch. Therefore, content must seamlessly flow across time, location and device.”

The report also discusses:
- How content is consumed in rapidly shrinking media boundaries.
- The powerful influence of social media on how and when we watch.
- Digital expansion opportunities by generation.
For more detail and insight, download Nielsen’s Global Digital Landscape report.
About the Nielsen Global Survey
The findings in this survey are based on respondents with online access across 60 countries. While an online survey methodology allows for tremendous scale and global reach, it provides a perspective only on the habits of existing Internet users, not total populations. In developing markets where online penetration has not reached majority potential, audiences may be younger and more affluent than the general population of that country. Additionally, survey responses are based on claimed behavior, rather than actual metered data.


