Sail Ma, Vice President, Online Product & Research, CR-Nielsen – a joint venture of The Nielsen Company in China
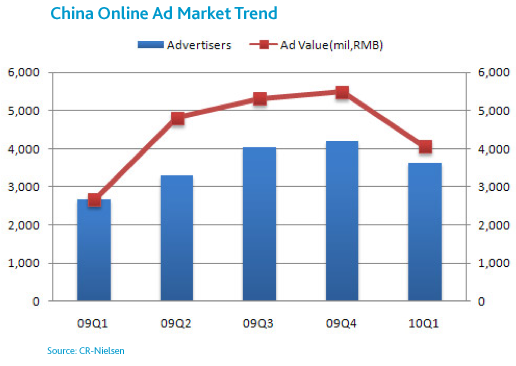
China’s growth in online advertising continues at a quick pace, reaching 4.06 billion RMB in the first quarter of 2010—a 52.7% increase over the same period in 2009. This trend is expected to continue for the remainder of the year. The Fashion industry was the top spender, with almost 18% market share. Half of the top 10 industries lost market share in the first quarter.
China’s advertising market kept up a fast pace in the first quarter of 2010, after enjoying a 39% year-over-year growth for 2009. More than 3,600 advertisers in China advertised online during this time—an increase of 36.2% from Q1 2009.
This is a good start for the Chinese online advertising industry. Despite the difficult economic environment many countries struggled through last year, China enjoyed growth, and saw tremendous increases. As more advertisers step into the online market and advertisers regain their confidence, this trend of rapid growth should continue into the remainder of 2010.

The Fashion category was the biggest spender, with a 17.7% of total market share. It is also a fast-growing industry, with market share increasing 3.3%, compared to Q1 of 2009. This top 10 industry played a major role in Q1, representing 87.6% share of the entire markets’ advertising value. Among the top 10, Real Estate is the only one that dropped in advertising value compared to 2009, leading to a 4.7% drop in market share. There were four other industries that also lost market share in Q1: Entertainment (-2.3%), Employment (-1.6%), Automotive (-0.2%) and Media (-0.2%).
| Top 10 Industries by Online Ad Value (Q1 2010) | |||
|---|---|---|---|
| Industry | Market Share | YOY Value Change | YOY Market Share Change |
| Fashion | 17.7% | 88.6% | 3.3% |
| Automotive | 15.7% | 50.9% | -0.2% |
| Retail | 10.8% | 552.7% | 8.3% |
| Computers/Electrical | 10.1% | 76.1% | 1.3% |
| FMCG | 8.8% | 90.2% | 1.8% |
| Finance | 8.0% | 78.4% | 1.2% |
| Entertainment | 7.0% | 15.0% | -2.3% |
| Real Estate | 3.5% | -36.1% | -4.7% |
| Employment | 3.2% | 2.4% | -1.6% |
| Media | 2.8% | 44.6% | -0.2% |
| Source: Nielsen CR-Nielsen All ‘Internet advertising’ mentioned in this article refers to display advertising only, search advertising and text advertising are not included. Advertising Value is based on CPM, and does not mean actual advertising spend or revenue. |
For more information, please visit www.cr-nielsen.com.


