What’s the next big thing? It’s a question retailers, manufacturers and marketers ponder incessantly so they can be at the forefront of growth with the latest innovations, media and consumer groups. And when it comes to looking for trendsetters in these areas, they would be wise to take note of American lesbian, gay, bisexual and transgender (LGBT) households.
Not only do LGBT households make 10% more shopping trips in a year than the average U.S. household, recent Nielsen research has found that they buy more at checkout. In aggregate, LGBT households spent an average of $4,135 at retail stores in 2014—7% more than non-LGBT households.
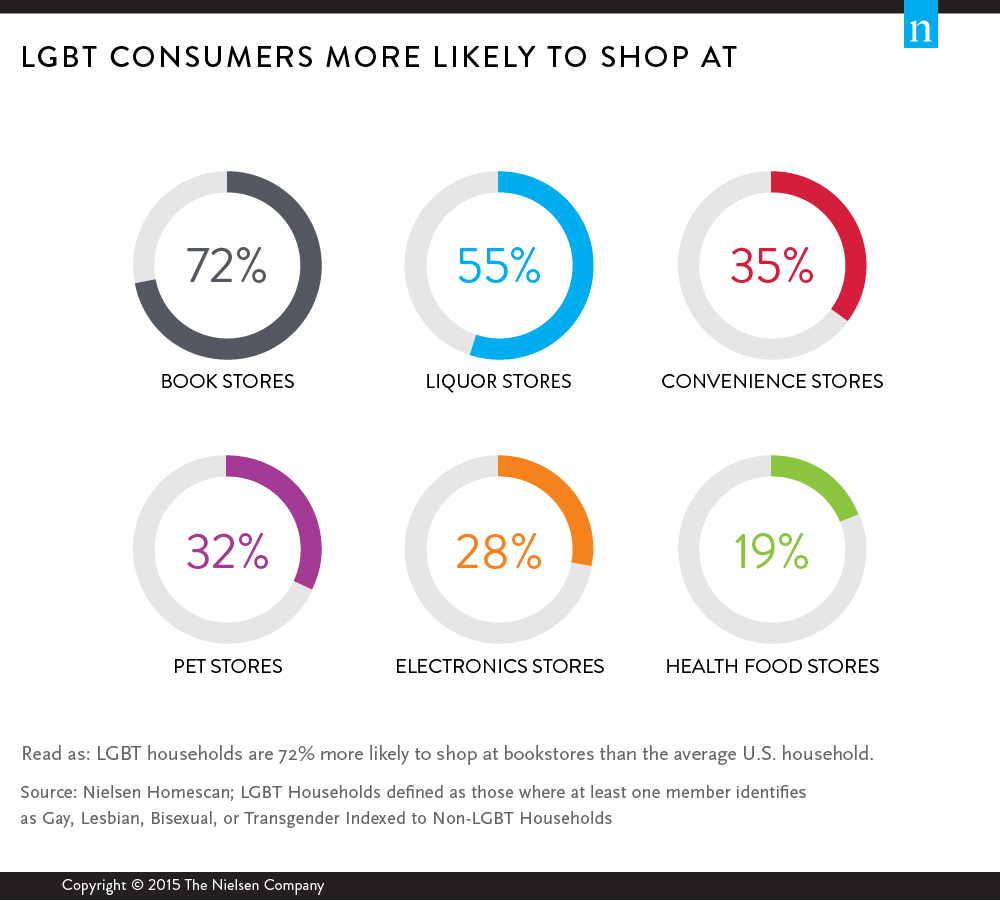
Where are LGBT Consumers Shopping?
LGBT consumers are spending more at specialty retailers than the average U.S. consumer, with bookstores leading the pack. In fact, they were 72% more likely to have purchased something from a bookstore in 2014. And what’s more, LGBT shoppers who visited a bookstore made twice as many trips as non-LGBT consumers. But LGBT consumers aren’t just bookworms. For example, liquor and convenience stores are high-ranking outlets.
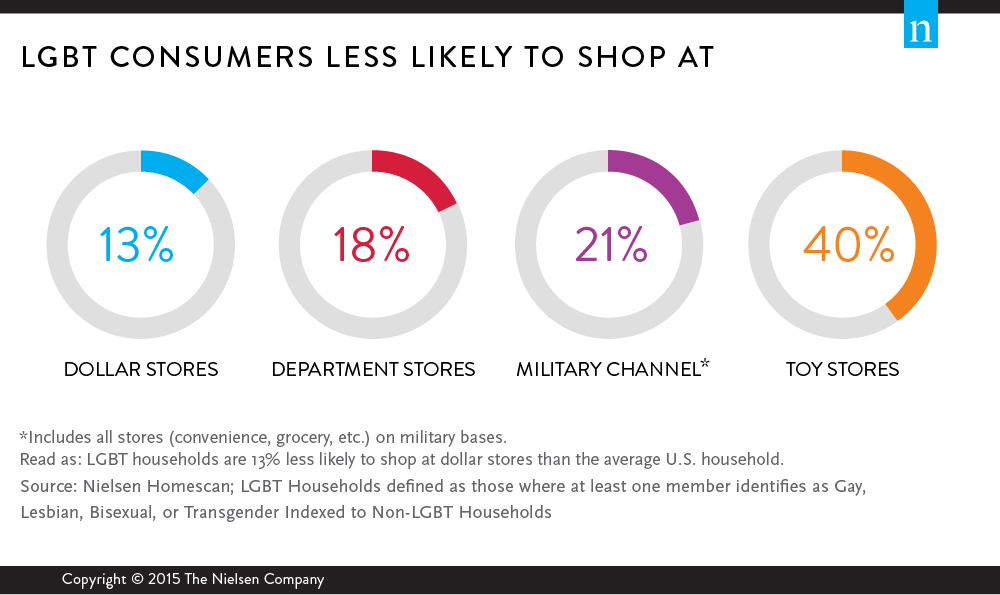
Not all specialty stores are on LGBT consumer’s radar, however. There are some retail outlets they’re less likely to shop at, such as toy stores.
What are LGBT Consumers Buying?
But understanding shopping behavior hinges on knowing more than just where consumers shop. For example, LGBT households are 32% more likely to shop at pet stores, but they also outspend the general public when they make their trips. Notably, households in this consumer group spent an average of $126 on pet care products and $255 on pet food last year, 36% and 20% more than the average household, respectively. They’re also more likely to spend more on alcohol, personal grooming items and electronics.
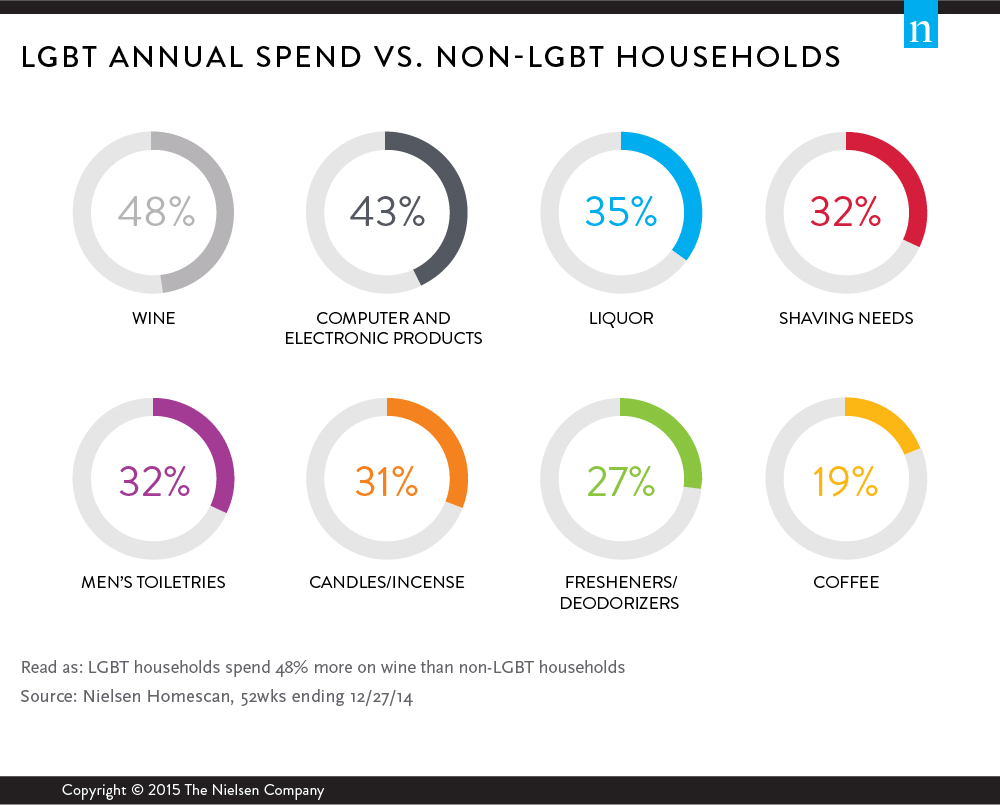
Online e-commerce continues to have strong traction with LGBT households, as they spend 35% more on online purchases each year than non-LGBT households. Categories where they spend significantly more online than their straight counterparts include snacks (by 122%), household cleaners (73%), coffee (69%) and medication (67%).
The LGBT community is a significant contributor to the U.S. economy, and savvy retailers should plan their shelf space accordingly. And by knowing what this group is looking for and how much of it they’re buying, retailers and manufacturers will be better equipped to develop and promote products that meet its needs and desires.
For additional insights, download Nielsen’s recent LGBT Consumer report.