Viewership trends are following high-profile content releases across platforms
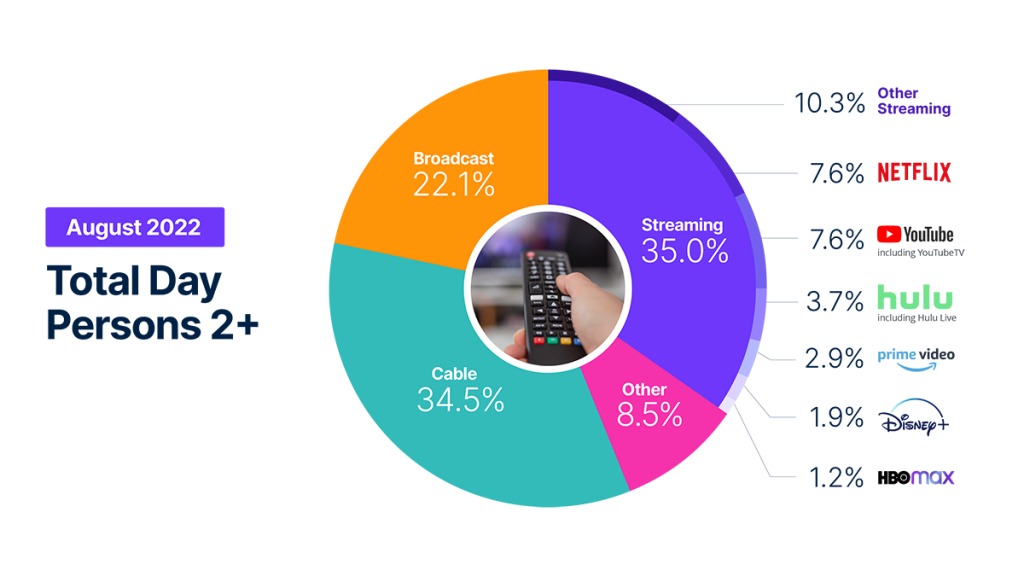
The impact of high-profile content across the individual streaming platforms has never been more evident as it has been in July and August, particularly amid the summer slowdown of new content on traditional television. Total streaming usage hit another record by claiming 35% of total TV usage in August, but audience engagement across platforms is starting to fluctuate depending on where the big-name content is.
On a year-over-year basis, streaming volume was up 22.6% compared with last August, while monthly usage was largely flat from July. At a platform level, audiences are going where the content is. In July, Netflix’s megahit Stranger Things inspired nearly 18 billion minutes of viewing. In August, that massive reaction subsided, contributing to 6.5% less usage and a 0.5-point loss in TV viewing share for the streamer. Comparatively, the much-anticipated debut of HBO’s House of The Dragon fueled a 13.7% increase in usage of HBO Max, resulting in a record 1.2% of TV time. Meanwhile, YouTube continued to grow its streaming stake, adding 2.8% in volume to tie Netflix—for the first time—to account for 7.6% of total TV usage. YouTube is also benefiting from its YouTube TV platform, which accounted for 11.9% of all YouTube viewing in August on the heels of a 14.9% increase in usage over July.
Linear streaming (the aggregation of live television apps offered by vMVPDs and MVPDs), represented 4.2% of total television usage in August. Linear streaming examples include Sling TV, Charter/Spectrum, Hulu Live, and YouTubeTV. Within the Gauge, linear streaming viewing is reflected in the streaming bucket, and broadcast or cable content viewed through these apps also credits to its respective category.
Individual streaming platform trends aside, total TV usage was down slightly in August, which is typical as summer winds down. In fact, broadcast was the only category that had a volume increase, up 1.6% which resulted in an additional half a share point. It was buoyed by an 11% bump in the General Variety category and a 3% increase in sports (NFL preseason, college football and the MLB Field of Dreams game). While down 0.4% from July, cable did benefit from a 13% rise in news viewing and a 27.4% increase in sports, led by NFL preseason games (on ESPN and the NFL Network) and the NASCAR Cup Series on USA Network.
Broadcast and cable viewing remained largely consistent from July, but year-over-year data highlights viewership declines of 10.9% and 9.4%, respectively. Given what we know about TV viewing behavior, the August data may reflect the calm before the storm, given the arrival of a new TV season, a new season of the NFL and the race across the MLB to make it into the postseason. The September edition of the Gauge will be a great illustration of how viewers engage with all that everything on TV has to offer.
Methodology and frequently asked questions
The Gauge provides a monthly macroanalysis of how consumers are accessing content across key television delivery platforms, including Broadcast, Streaming, Cable and Other sources. It also includes a breakdown of the major, individual streaming distributors. The chart itself shows the share by category and of total television usage by individual streaming distributors.
How is ‘The Gauge’ created?
The data for The Gauge is derived from two separately weighted panels and combined to create the graphic. Nielsen’s streaming data is derived from a subset of Streaming Meter-enabled TV households within the National TV panel. The linear TV sources (Broadcast and Cable), as well as total usage are based on viewing from Nielsen’s overall TV panel.
All the data is based on a specific time period for each viewing source. The data, representing a 5 week month, includes a combination of Live+7 for weeks 1 – 4 in the data time period. (Note: Live+7 includes live television viewing plus viewing up to seven days later. Live +3 includes television viewing plus viewing up to three days later.)
What is included in “Other”?
Within The Gauge, “Other” includes all other TV. This primarily includes all other tuning (unmeasured sources), unmeasured video on demand (VOD), streaming through a cable set top box, gaming, and other device (DVD playback) use. Because streaming via cable set top boxes does not credit respective streaming distributors, these are included in the “Other” category. Crediting individual streaming distributors from cable set top boxes is something Nielsen continues to pursue as we enhance our Streaming Meter technology.
What is included in “other streaming”?
Streaming platforms listed as “Other Streaming” includes any high-bandwidth video streaming on television that is not individually broken out.
Where does linear streaming contribute?
Linear streaming (vMVPD/MVPD Apps) are included in the streaming category and represented 4.2% of total television in August 2022. Broadcast and cable content viewed through these apps also credits to its respective category.
Do you include live streaming on Hulu and YouTube?
Yes, Hulu includes viewing on Hulu Live and YouTube includes viewing on YouTube TV.
Encoded Live TV, aka encoded linear streaming, is included in both the Broadcast and Cable groups (linear TV) as well as under Streaming and other streaming e.g. Hulu Live, Youtube TV, Other Streaming MVPD/vMVPD apps. (Note: MVPD, or multichannel video programming distributor, is a service that provides multiple television channels. vMVPDs are distributors that aggregate linear (TV) content licensed from major programming networks and packaged together in a standalone subscription format and accessible on devices with a broadband connection.)