A Q&A with Michelle Andreas, VP, Client Consulting, Nielsen

In today’s shifting and divisive political climate, sophisticated voters are in search of relevant political messaging to better understand how their local, state and presidential candidates can best serve their needs. For many voters, politics has bled into every part of their lives from the shows they watch to the podcasts they listen to.
Earlier this year, Nielsen announced the launch of its syndicated Nielsen Voter Ratings solution, which combines nationwide voter registration data and Nielsen’s local TV, audio and digital currency data to help local or presidential candidates understand where and how to reach their audiences.
In a country where red states and counties are flipping blue, and blue states red, being able to reach undecided voters with the right message may determine the fate of today’s political candidate. Michelle Andrews sat down with Joe Mandese of MediaPost’s Marketing Politics Weekly to explain.
Marketing Politics Weekly: Voter ratings seem natural. Why is Nielsen creating them now, and why didn’t the company do them before?
Michelle Andreas: The big news is that we’ve extended the Nielsen Voter Ratings solution to all 208 TV markets, leveraging innovative technology and the same kind of Big Data that fuels Nielsen’s Local Television measurement. Market awareness around the limitations of Set Top Box only data in conjunction with the work Nielsen has been doing to integrate Return Path Data with Nielsen’s Local TV panels in 208 DMAs prompted requests from clients to build a voter ratings solution tied to the currency data.
Previously, we had been in the space for the last few political cycles but with a more custom solution limited to the top 56 markets. Now that the local tv transformation is completed, we’ve been able to match voter behavior and registration data to the panel+RPD foundation and extend Nielsen Voter Ratings to all 208 markets.
MPW: Are there insights in this data that can be applied by general market advertisers, or does it mostly just have utility for political marketers? If so, please explain.
Andreas: While the Nielsen Voter Ratings solution will likely have the most utility for political marketers, it can offer insights on the political composition of local and national audiences to inform programming decisions for media owners. There are also insights on the lifestyle and product preferences of voters which provide context on the causes and organizations consumers support, which would be relevant for fundraising and issues advertisers.
MPW: What is the most interesting or surprising insight you’ve come upon since processing these ratings?
Andreas: One surprising insight is that Nielsen Voter Ratings uncovers programs that can be dramatically more efficient in voter delivery and provides another datapoint to inform political planning and buying. Other interesting insights include differences on a market by market level in Spanish language and English language program viewing among Hispanic voters; Fox audiences aren’t all Republican; and niche cable programming offers opportunity to reach key voter audiences.
MPW: Americans seem more politically divided than ever. Is that reflected in their TV viewing preferences too, or is there greater unity when it comes to television programming?
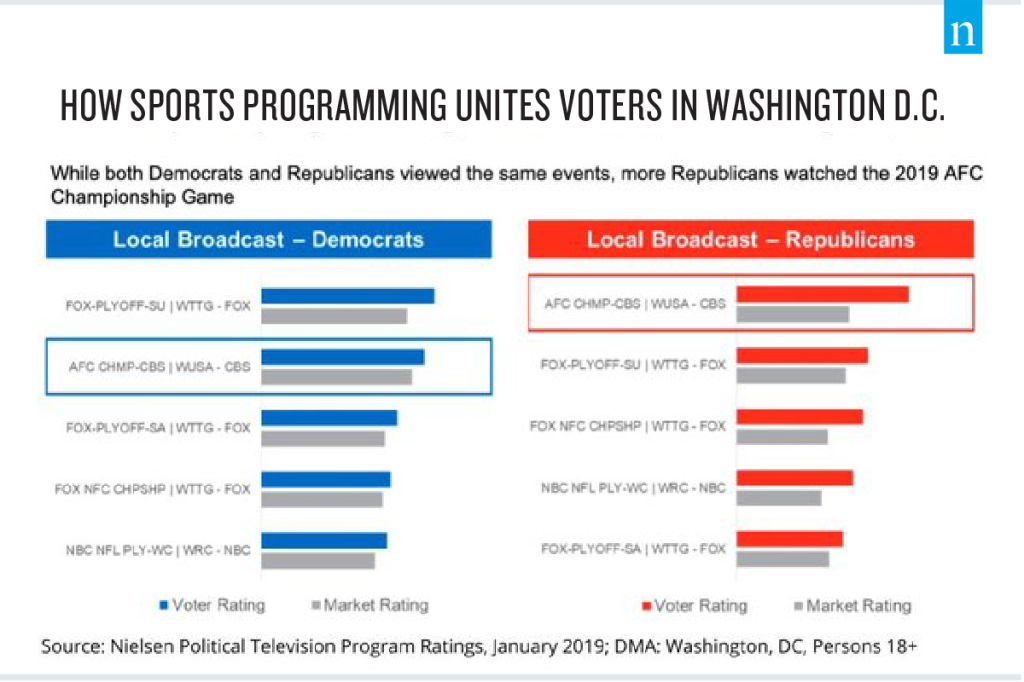
Andreas: There’s a little of both. Sports seems to unite fans and voters alike but we definitely see differences within and across markets in the voter composition of sports audiences. In DC, while the top five sports programs viewed by Democrats and Republicans in Jan.’19 were similar, overall voter audience delivery was higher among Democrats but the games over-indexed for Republicans, showing they reached a high concentration of Republican voters (see example below).

This article originally appeared in MediaPost on Marketing: Politics Weekly.
VISIT THE ELECTION HUB
For more current and historical TV ratings for election events and voter data


