The Next Frontier
Your Guide to the 2024-25
Upfronts / NewFronts
Planning Season
Discover the data and insights you need to navigate a shifting media landscape: new media habits, surprising audience insights and engagement opportunities across the next year of programming.

Overview
Contending with change
Three paradigm shifts are upending this year’s Upfronts/Newfronts planning season.
1
Programming trends
Convergent TV is redefining planning
In a world where linear broadcast and cable represent just half of overall TV viewing, the traditional TV season’s rule over the calendar may be shifting.
Discover platform and programming trends that illustrate the rising convergence of linear and streaming TV.
2
Audience trends
Your audience today isn’t the same as yesterday’s
Succeeding in tomorrow’s TV environment means striking the right balance of contextual, advanced targeting, and one-to-one advertising. It’s a new game.
Examine key audience trends that demonstrate the uniqueness of today’s TV viewing audiences.
3
Ad trends
Linear TV is big but it’s only half of the equation
As the line of what is and isn’t considered “television” blurs, measurement silos should be a thing of the past. Advertisers need to know how their TV buys are performing in the context of their cross-media campaigns.
Review important cross-media considerations through current ad trends and outcomes insights.

Want access to more insights?
Download the full guide for additional data and analysis

Section 1
Programming trends
The convergence of linear and streaming is transforming TV
The advent of Convergent TV1 impacts both the way that people consume content and in the way that media companies produce and release new programming to meet that demand.
Here are four lessons we can draw from current trends in programming and platform adoption:
8.5%
BBO homes are rising
Broadband-only homes have been climbing at this quarterly rate for the past three years. Still, most TV homes watch some form of linear programming.
90%
TV reaches most of U.S population
TV reaches the overwhelming majority of U.S. population in one form or another over the course of any given week, and the growing adoption of streaming and CTV devices may start to smooth seasonality out of TV usage for programming beyond sports.
40%
Streaming accounts for majority of TV usage
Close to half of total TV usage is now spent with streaming (whether from digital-first or legacy TV companies), making it the dominant form of TV viewing in the U.S.
30%
Streaming’s growth in weekly program volume
Growth in weekly program volume across streaming platforms, which raises the public’s expectations for new, bingeable TV programming outside of the traditional TV season.
1 Convergent TV is the combination of linear and streaming into a seamless viewing experience.
TV usage continues to grow thanks to CTV
Both reach and time spent are still on the rise
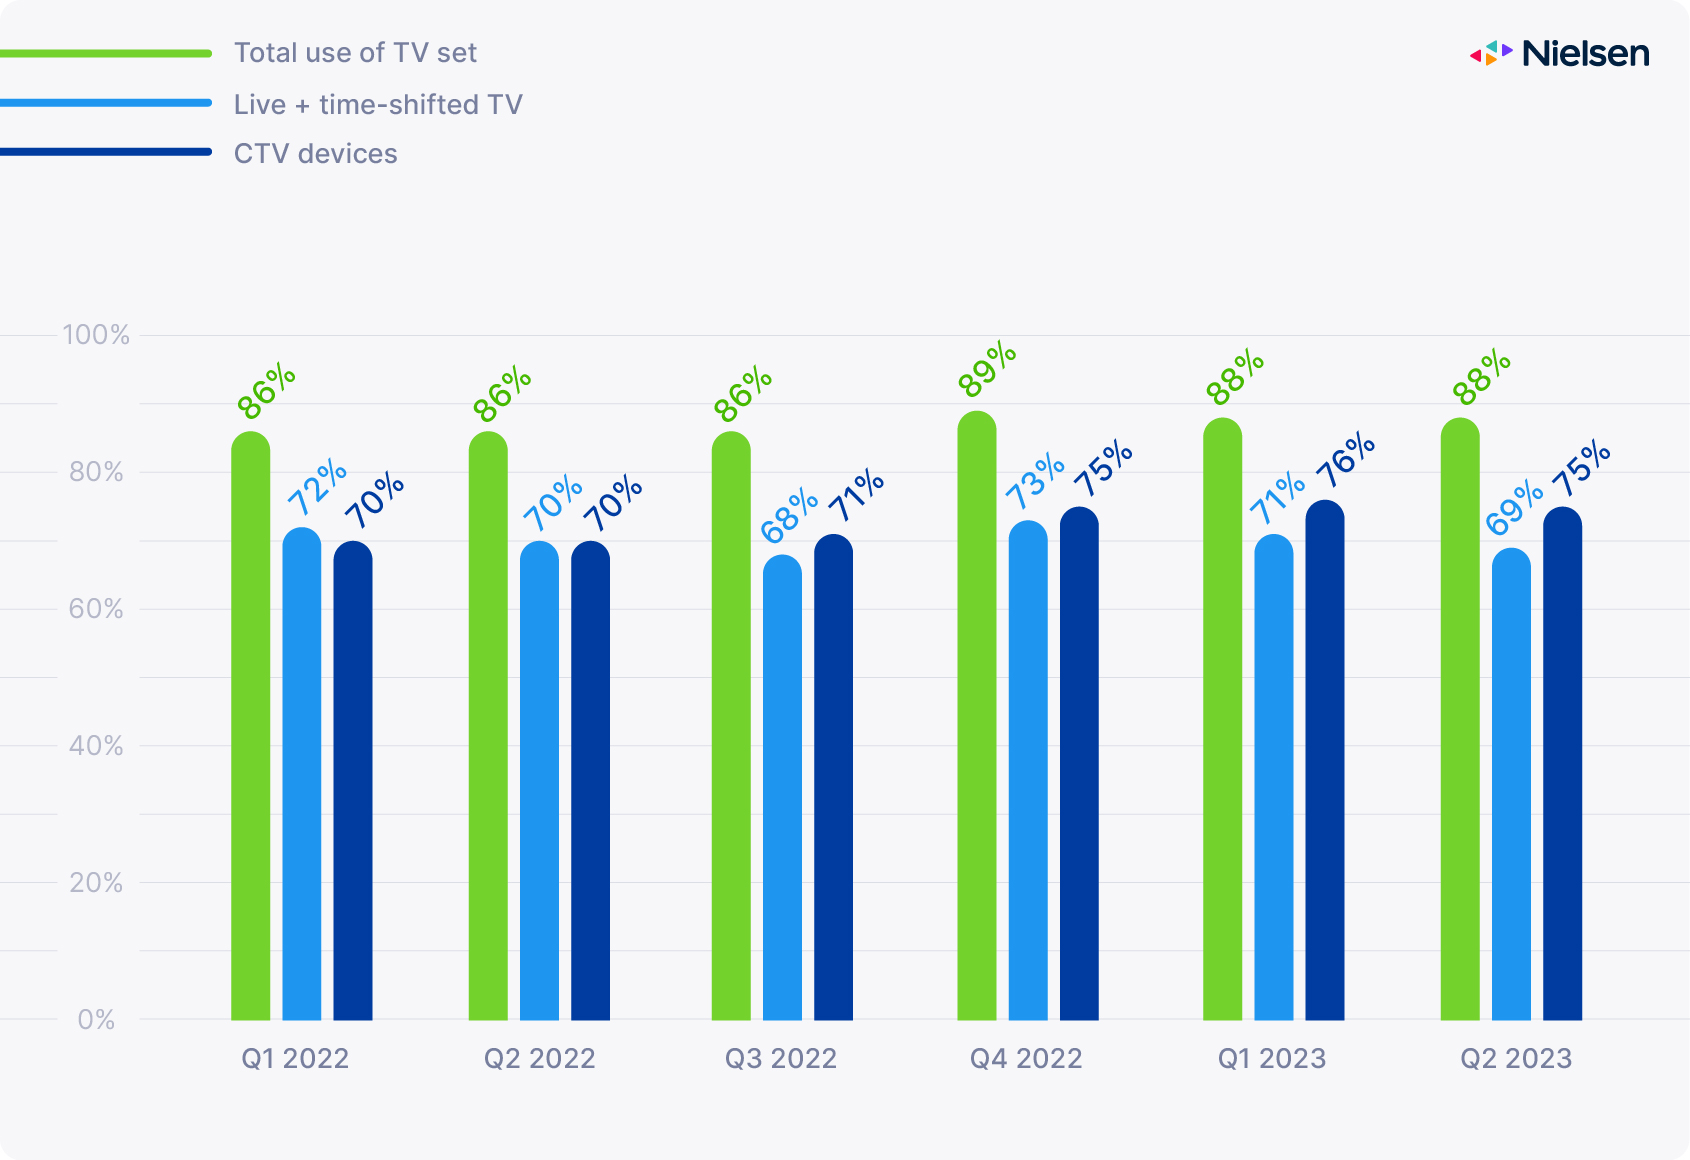
For CTV devices, weekly reach was 75% of all U.S. households in mid-2023, five percentage points higher than a year earlier. And the growing importance of streaming in our daily lives is even more evident when we examine time spent. Streaming rolled past cable in November 2022, and as of September 2023, accounted for 37.5% of total TV time, all ages combined.

Source: Nielsen U.S. National TV Panel, weighted households data April 2021- October 2023
Broadcast typically goes up in the fall thanks to football, new series and the return of old favorites. Cable sees a similar bump in the spring with March Madness and the NBA Playoffs. The WNBA tournament was particularly successful in 2023, both on ESPN and on ABC and ESPN+ for the final. In Fall 2023, sports programming again drew viewers in and appears to be shielding broadcasters from the full impact of the recent WGA and SAG-AFTRA strikes, at least for the moment.
The ongoing shift of more sports programming to streaming platforms is likely to have major repercussions in 2024, although new local sports rights deals and the rise of FAST TV might moderate that effect, especially in an Olympic and election year.
The bottom line
Broadcast and cable are entertainment pillars, but we’re firmly in the streaming age.
The platform and programming trends highlighted above confirm that the streaming headlines are not overhyped, and the changes we’re observing in our own media behavior are part of a structural shift towards Convergent TV in the industry.
These are the implications for advertisers, agencies, publishers and measurement.
For advertisers and media agencies
TV remains a central piece of the marketing mix.
TV is just as relevant today as it ever was. In fact, it’s a more complete advertising channel now because it’s increasingly powerful for mid- and bottom-funnel campaigns because of CTV targeting capabilities, as well as top-funnel branding campaigns. This year, look for non-scripted content like sports, reality, game shows and news programming to continue to support linear TV, and for new waves of international content to light up streaming platforms.
For publishers
Seasonality isn’t gone, but there are exciting ways to fill gaps in the traditional TV schedule.
There’s also room for FAST services to continue blurring the line between streaming and classic TV. This changes the TV programming (and counter-programming) game and puts pressure on the Upfronts to adapt to the new environment, but it also creates a major incentive for superior program scheduling.
For measurement
An adtech ecosystem combining the best of linear and digital is now the top objective.
Developing this will give stakeholders the tools they need to buy and sell with confidence.At the heart of that system, the industry needs common, cross-media metrics: a way to measure ad delivery and performance consistently across platforms.

Want access to more insights?
Download the full guide for additional data and analysis

Section 2
Audience trends
TV viewers aren’t adopting new platforms with same enthusiasm
As of June 2023, Gracenote had cataloged nearly 100 streaming services in the U.S. alone and over 30,000 different channels. In such a highly fragmented landscape, it would be wrong to expect that a show like Suits would appeal to exactly the same types of viewers on Netflix and Peacock TV as it did on USA Network, or that Yellowstone would attract the same audience on CBS as it does on Paramount+.
At a high level, streaming audiences are very different from linear audiences.

Weekly reach
While CTV is growing across all segments, there are persistent, sizable differences in weekly reach across age and race/ethnic groups.

Time spent
While time spent on linear TV grows dramatically with age, it’s more uniform on connected devices. Still, there are substantial variations in time spent by segment, with different age groups leading the way for different race/ethnic groups.

Channel preference
Streaming represents a much greater proportion of TV time for young viewers than it does for older viewers: 60% (18-34) vs. 32% (50-64) and 18% (65+) as of Aug 2023.
There are persistent gaps in CTV weekly reach
Interest remains uneven across age and race/ethnic groups
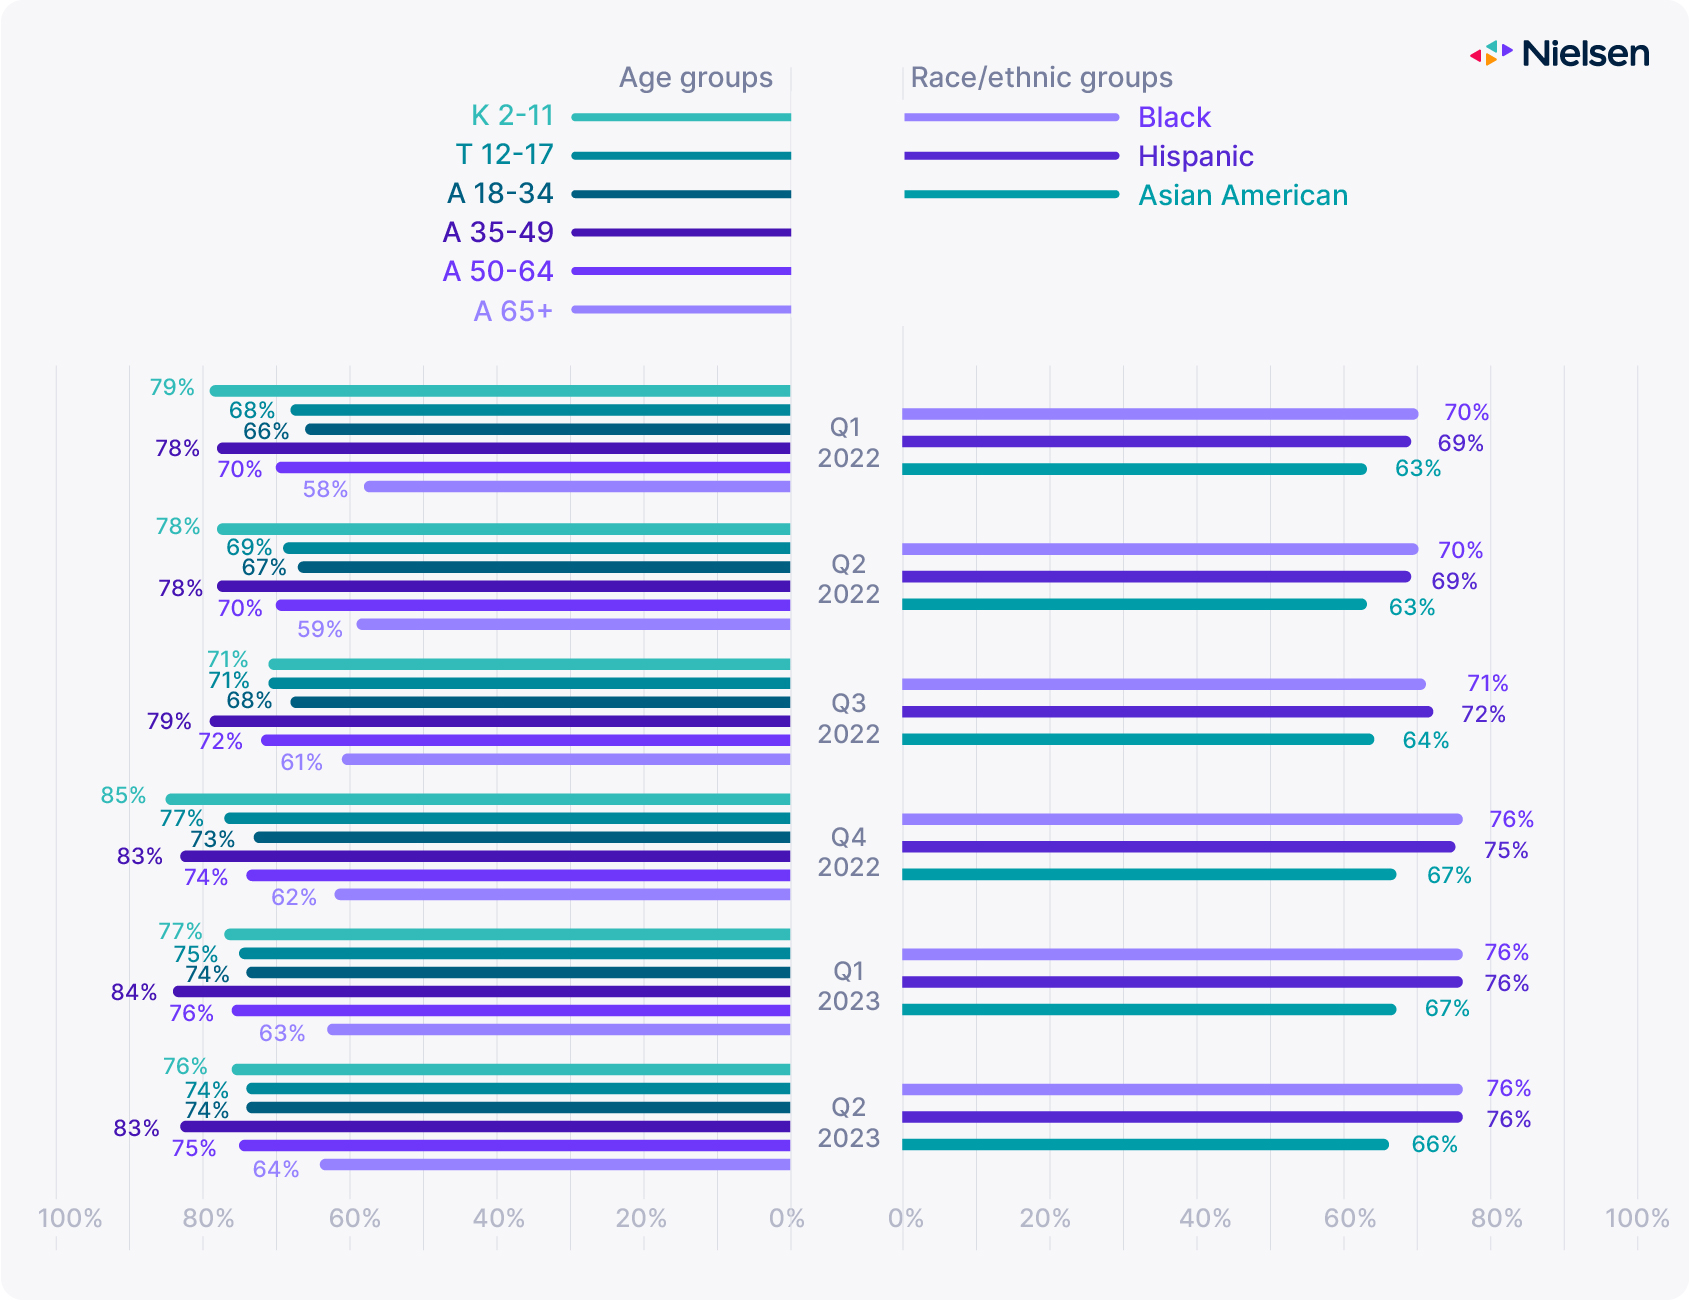
The weekly reach of CTV devices had climbed five percentage points from early 2022 to mid-2023, with CTV now accounting for a third of total TV usage. Now let’s see how it changed for various demographic groups.

Source: Nielsen National TV Panel Q1 2022-Q2 2023
While the weekly reach of CTV devices is improving across virtually every segment of the population, there are wide and persistent gaps: Middle-age adults (35-49) and their young kids (2-11) are leading the way with a weekly reach of 83% and 85%, respectively, while older viewers (65+) are lagging 20 percentage points behind—but still growing at the same rate as the rest of the population” +8% YoY.
CTV’s reach among Hispanic and Black viewers has been slightly above average since Q4 2022, but it’s remained consistently below average for Asian American viewers, and the gap appears to be widening.
The bottom line
More is needed to address the incredible diversity of modern TV audiences.
Broad demographics like age and gender have long been used for audience segmentation because it was reasonable for advertisers to expect that certain combinations of programs, networks and dayparts skewed more or less heavily along those dimensions. That’s no longer the case.
Here’s what it means for advertisers, agencies, publishers and the adtech ecosystem.
For advertisers and media agencies
Start thinking about TV audiences and digital audiences in the same way.
Which is to say: rich, varied, granular and quick-changing. TV has long been one of the best advertising vehicles for top-funnel, branding campaigns. But it’s also a contextual platform at heart. And now that it’s addressable, TV can be used to reach a brand’s target consumers much closer to the point of purchase and as an integral part of a well-orchestrated cross-media campaign.
For publishers
Seize the opportunity to analyze your own audience data.
Find out what their strengths are and develop a distinct audience catalog that’s relevant to their advertising clients. There are many ways to define audience segments: TV viewership patterns are a key part of course, but also any other ethically-sourced data that could help boost advertising performance, like psychographics, life stage or purchase data.
For measurement
Evolve past compatibility to be symbiotic with other media.
It’s not as simple as retrofitting the existing digital ecosystem. Identity, data onboarding, audience creation, activation, measurement and optimization are all different in the TV space, and a big part of the challenge ahead is to develop these functions in a way that’s not just compatible but symbiotic with other media.

Want access to more insights?
Download the full guide for additional data and analysis

Section 3
Ad trends
How to answer the ultimate question: What’s the ROI?
Many channels are better at meeting either short-term or long-term objectives, but rarely both. And with so many streaming services offering ad-supported tiers now, the options keep expanding and the bar seems to be getting higher every day.
Here are three lessons we can learn from current trends in ad spend.
9%
On the macro level, ad spend dropped
Q3 ad spend dropped 9% YOY, but a look at the top 15 advertising sectors shows substantial differences by industry.
54%
Digital grabbed lion’s share of investment
Looking specifically at TV, radio and digital ad spend, 54% of total ad spend went to digital, 39% to TV and 7% to radio. But it’s not a one-size-fits all. Some industries (like auto or pharma) over-indexed on TV, while others (like retail or apparel) over-indexed on digital.
50%
Half of media plans are risking their ROI
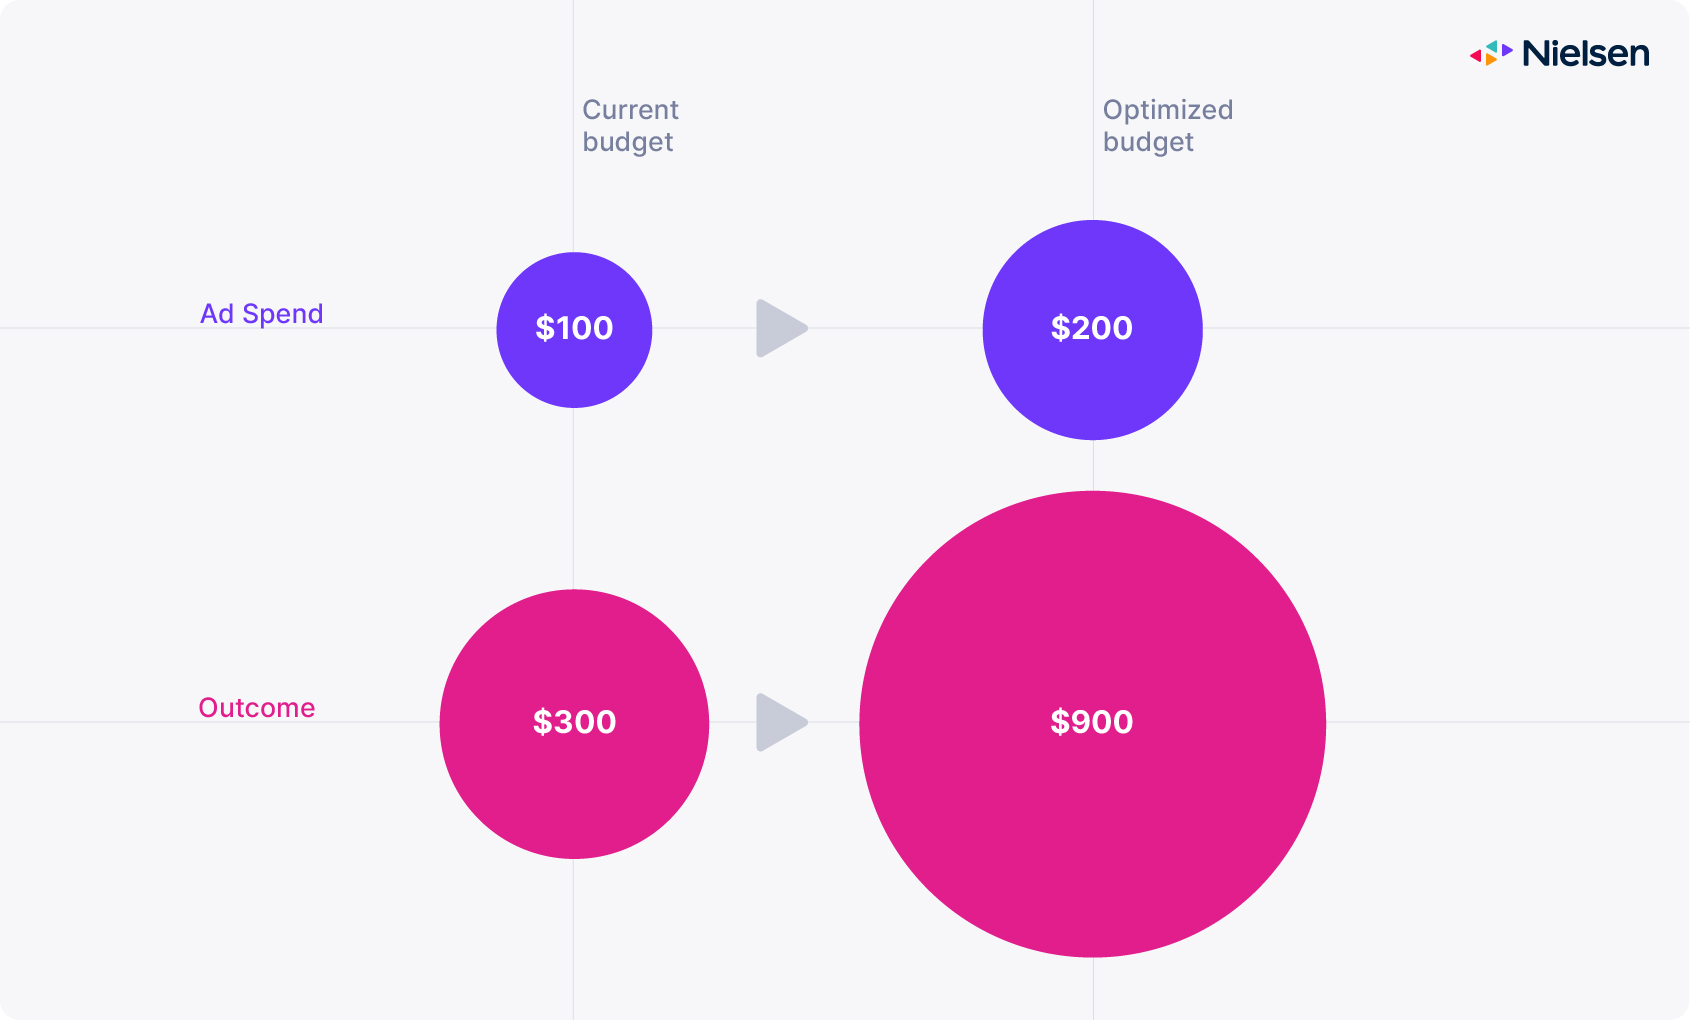
We analyzed thousands of marketing mixes and found that 50% of media plans are underinvested in critical media channels and shortchanging their ROI by 50%.
ROI drives media decisions, but it isn’t always optimized
Budget allocation can have an outsized effect on outcomes
A 2022 Nielsen study of 150,000 observations of marketing ROI and client-supplied media plans found that 50% of planned media investments on channels as diverse as linear TV, digital display, digital video and social media were too low to achieve top ROI.

Source: Nielsen Predictive ROI database, May 2022
Underinvestment is a chronic problem. Advertisers today are spreading their media budgets much thinner than ever before, failing to hit minimum investment thresholds, and leaving a lot of money on the table. Common cross-media metrics and more compatible measurement solutions will go a long way to address that challenge and unlock higher returns for all stakeholders.
The bottom line
Marketers face a difficult choice when navigating complex cross-media marketplace dynamics.
With increased competition, media fragmentation and budgets under pressure, marketers have to make difficult decisions: invest in promising new channels and strategies (for instance, performance-based campaigns on CTV), even if they can’t measure their ROI with absolute confidence; or stay with what worked in the past until standards or reliable common metrics emerge.
Here’s what advertisers, publishers and measurement solutions can do to move the needle.
For advertisers and media agencies
Maintain constant vigilance.
The pace of change is too fast for old budget allocations to work for very long. Advertisers and their agencies should continue frequently refreshing their marketing mix models to keep up with consumer and viewer behavior. There’s a lot of room for improvement, even on well-established channels with a long research track record, like TV and display.
For publishers
Be transparent with data.
It’s in every publisher’s interest to measure the value of its audiences and monetize its ad inventory for what it’s truly worth. By prioritizing transparency with buyers, you help them assess whether you’re a good match for their campaign objectives, and to help them measure performance quickly and with metrics that are highly relevant to their business outcomes.
For measurement
Provide a deduplicated, cross-media view of performance.
That doesn’t mean that the industry should ignore the unique values associated with individual channels. Multiple channel-specific metrics can and should coexist. But there needs to be a basis for comparison that cuts across all platforms and works for everyone.

Want access to more insights?
Download the full guide for additional data and analysis

Takeaways
Implications for media stakeholders
Data-backed recommendations for reaching audiences and proving impact in the age of converging TV.

TV remains a central piece of the marketing mix, and is a more complete full-funnel channel now because it’s both scalable and addressable.

Think about TV and digital audiences in the same way: rich, varied, granular and quick-changing.

Maintain constant vigilance. Change happens too fast for old budget allocations to work, and there’s opportunity to improve even well-established channels

Seasonality isn’t gone, but there are exciting ways, like personalized user experiences, to fill gaps in the traditional TV schedule.

Seize the opportunity to analyze your own audience data to develop a distinct audience catalog that’s relevant to advertising clients.

Be transparent with data to help buyers better match inventory with outcomes.

The industry needs common metrics to live at the heart of an adtech ecosystem combining the best of linear and digital.

Prioritize media symbiosis, which requires more than just retrofitting the existing digital ecosystem

Provide a deduplicated, cross-media view of performance as a basis for comparison that cuts across all platforms.

