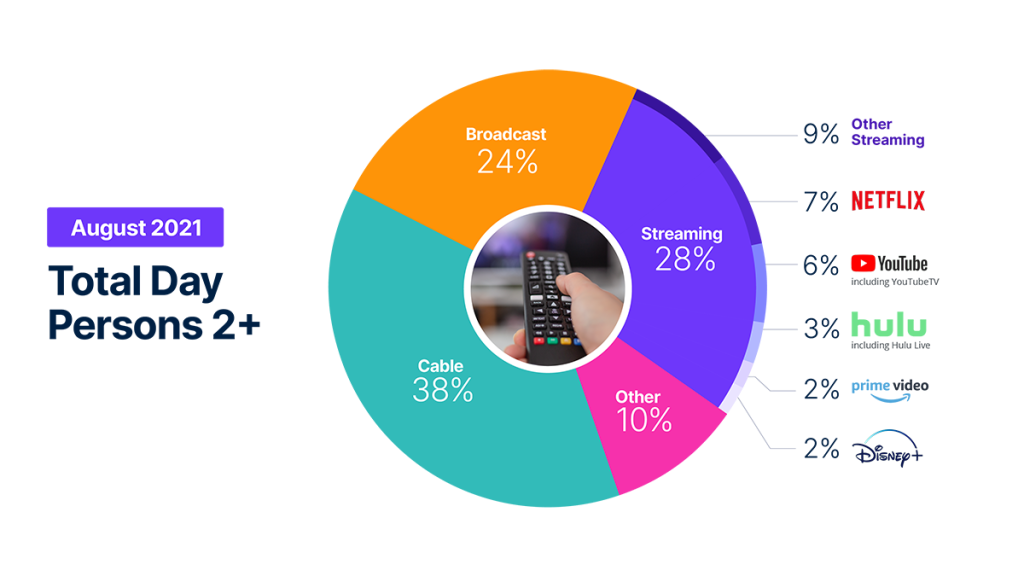
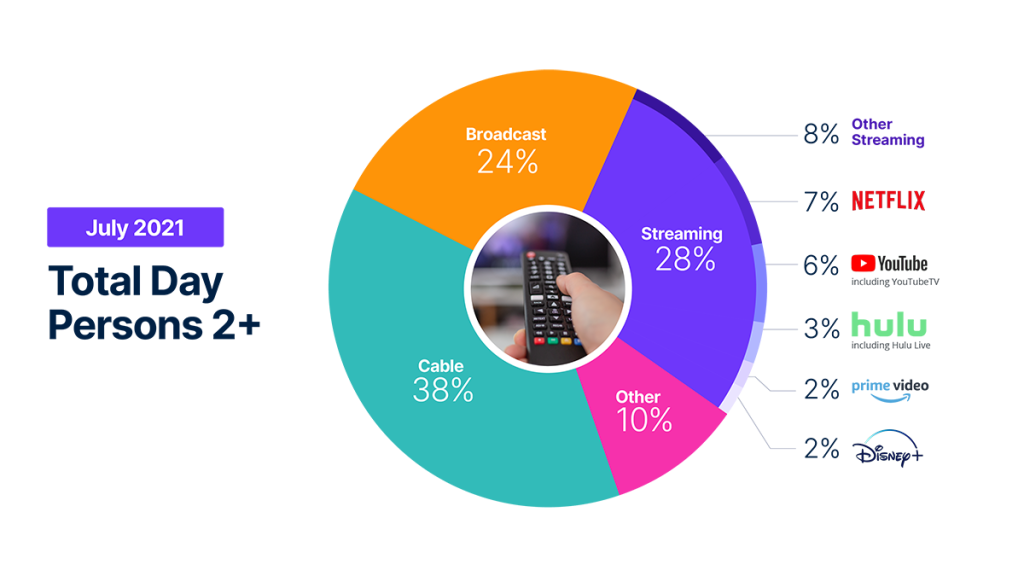
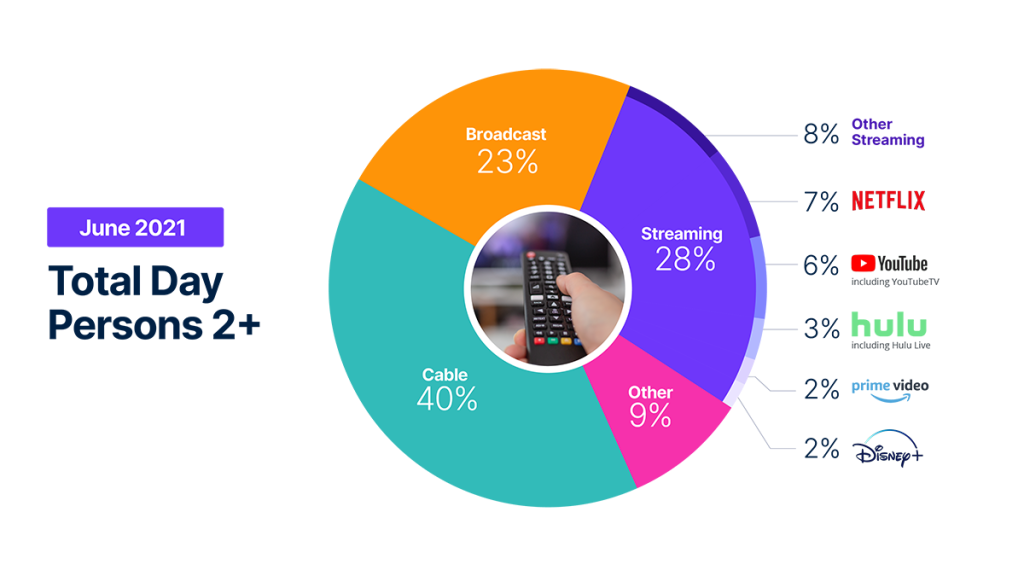
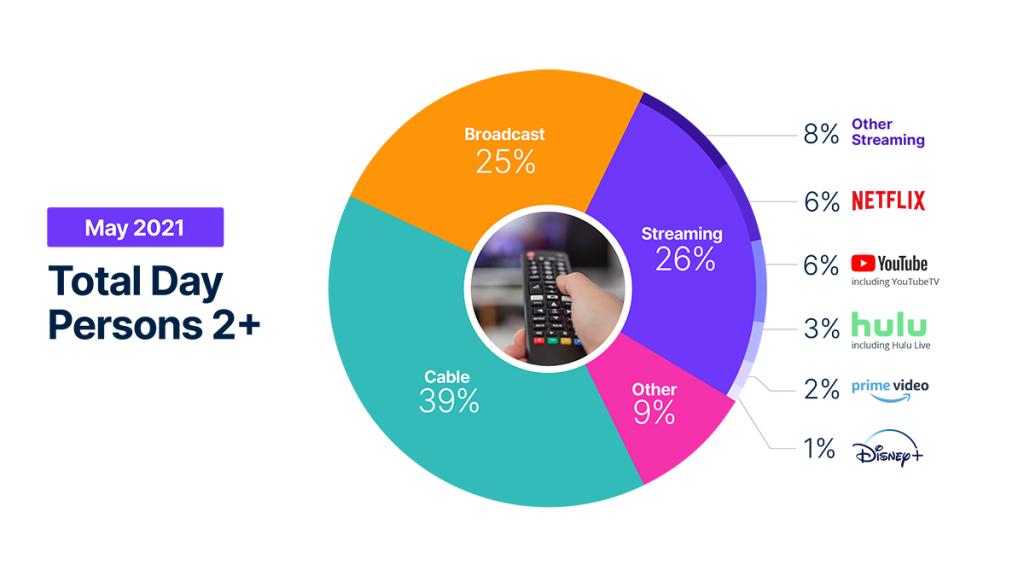
After three months of consecutive growth, the rise of streaming took a pause this month, according to the August release of The Gauge, Nielsen’s Total TV and Streaming viewing snapshot.
Compared to July, The Gauge’s reported August numbers remained mostly static, belying two strong undercurrents of change: the revival of a largely in-person school season and one of the highest-profile events in sports, The Olympics.
Streaming overall was relatively flat, but changes in viewership among back-to-school-aged kids 6-17 were more pronounced, decreasing by 7.5% since July according to detail from Nielsen’s Streaming Video Ratings. Despite the academic year’s impact, more adult-oriented streaming platforms did see gains in the “Other Streaming” category, increasing by 1 share point.
However, Total TV use was up about 0.5%, with broadcast showing gains of 2.9%. The Olympics were a driver of the broadcast boost, dominating television rankings each night they aired. Other notable sporting events in August included the MLB Field of Dreams game on Broadcast and the NFL Hall of Fame game on Cable.
Take me to the methodology details below.
Watch the video to hear Brian Fuhrer, SVP, Product Strategy at Nielsen dive into the interesting underpinnings of The Gauge. Stay tuned to see who will win the competition for viewers next month, as more students go back to school around the country and with the return of a new broadcast season.
METHODOLOGY AND FREQUENTLY ASKED QUESTIONS
The Gauge provides a monthly macroanalysis of how consumers are accessing content across key television delivery platforms, including Broadcast, Streaming, Cable and Other sources. It also includes a breakdown of the major, individual streaming distributors. The chart itself shows the share by category and of total television usage by individual streaming distributors.
How is ‘THE GUAGE’ created?
The data for The Gauge is derived from two separately weighted panels and combined to create the graphic. Nielsen’s streaming data is derived from a subset of Streaming Meter-enabled TV households within the National TV panel. The linear TV sources (Broadcast and Cable), as well as total usage are based on viewing from Nielsen’s overall TV panel.
All the data is based on a specific time period for each viewing source. The data, representing a 5 week month, includes a combination of Live+7 for weeks 1 – 4 in the data time period and Live+3 for week 5. (Note: Live+7 includes live television viewing plus viewing up to seven days later. Live +3 includes television viewing plus viewing up to three days later.)
What is included in “OTHER”?
Within The Gauge, “Other” includes all other TV. This primarily includes all other tuning (unmeasured sources), unmeasured Video on Demand (VOD), Streaming through a cable set top box, Gaming, and other device (DVD Playback) use. Because Streaming via Cable Set Top Boxes does not credit respective streaming distributors, these are included in the “Other” category. Crediting individual streaming distributors from Cable Set Top Boxes is something Nielsen continues to pursue as we enhance our Streaming Meter technology.
What is included in “OTHER STREAMING”?
Streaming platforms listed as “Other Streaming” includes any high-bandwidth video streaming on television that is not individually broken out.
Do you include live streaming on hulu and youtube?
Yes, Hulu includes viewing on Hulu Live and Youtube includes viewing on Youtube TV.
Encoded Live TV, aka encoded linear streaming, is included in both the Broadcast and Cable groups (linear TV) as well as under Streaming and other streaming e.g. Hulu Live, Youtube TV, Other Streaming MVPD/vMVPD apps. (Note: MVPD, or multichannel video programming distributor, is a service that provides multiple television channels. vMVPDs are distributors that aggregate linear (TV) content licensed from major programming networks and packaged together in a standalone subscription format and accessible on devices with a broadband connection.)


