Nielsen’s recent Social Media Report revealed the size of the audience and the degree of consumption across social networking platforms in the U.S., and now new research by NM Incite, a Nielsen/McKinsey Company, further explores the reasons U.S. social media users visit these sites.
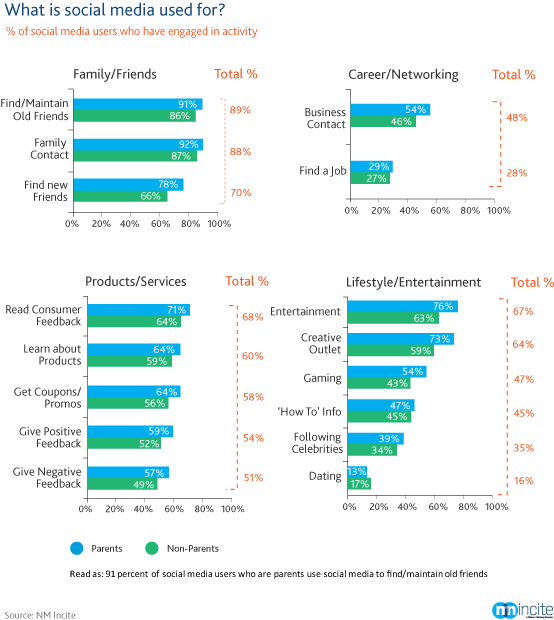
Not surprisingly, the top drivers of social media use among social networkers are keeping in touch with family and friends (89% and 88%, respectively) and finding new friends (70%). Another driver of use is the desire to view and contribute to reviews of products and services as 68 percent of social media users go to social networking sites to read product reviews and over half use these sites to provide product feedback, both positive and negative. Other top reasons social media users engage in social networking include entertainment (67%), as a creative outlet (64%), to learn about products (58%), and to get coupons or promotions (54%).
The study also looked at the differences in use among social media users with children and those without, finding that parents are more likely than non-parents to use social media for almost every thing, with dating being the exception. Parents are 26 percent more likely than non-parents to visit social networks to play games, 23 percent more likely to use as a creative outlet and 20 percent more likely to use for entertainment.

Methodology
NM Incite’s ‘State of Social Media Survey’ is based on a representative sample of 1,865 adult (18+) social media users who were recruited from the Nielsen Online Panel to take an online survey. “Social media user” is defined as participating, talking, and networking online through various platforms to share information and resources. This includes Internet forums, blogs, Facebook, Twitter, video sharing, consumer rating and other social networking websites. The survey fielded from March 31 to April 14, 2011.


