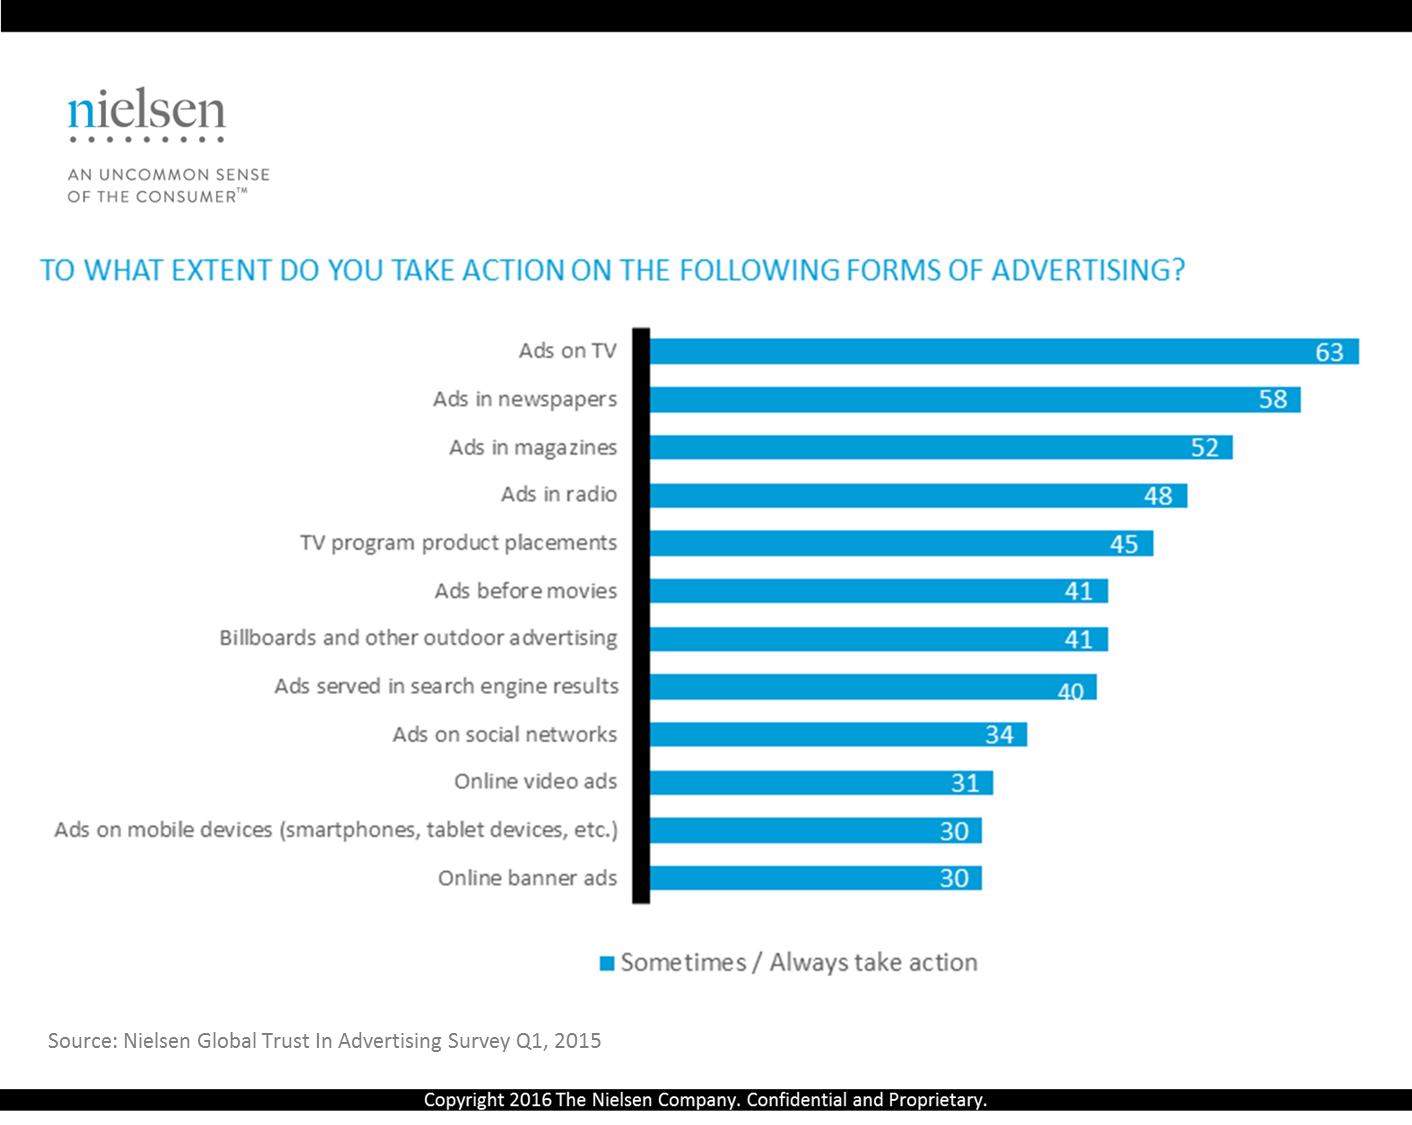
More than six in 10 online Australians said they would take action as a result of an ad seen on TV, making this the most powerful paid advertising platform to drive a consumer reaction.
In a global survey conducted by Nielsen on trust and reaction across various forms of advertising, results revealed that TV advertising very much strikes a chord with Australian audiences. Well over half of all online Australians say they trust ads on TV, highlighting that the success of digital forms of advertising has not eroded trust in this traditional medium.

Of course, looking across the entire results from Nielsen’s Global Trust Survey, the most trusted source of information on a brand, product or service is from other consumers. Four in five online Australians trust recommendations from someone they already know and the same amount are likely to act on that recommendation.
Reaching your audience is an important component of any ad campaign, but what good is ad reach if it doesn’t resonate with the audience? When asked ‘what type of advertising message resonates most,’ Australians had humorous at the top of the list.
Similarly, Nielsen’s Consumer & Media View insights show free to air (FTA) TV ads are interesting to talk about for 57% of people and ads on FTA TV ‘really stand’ out for more than half of the population who are heavy or medium FTA TV viewers. Gen Y and Gen Z viewers are more likely to prefer ads to have the same feel as the program they are watching.
The importance of understanding your audience and catering to their tastes cannot be overestimated. Regardless of the delivery format, the most successful ads are those that speak to the sentiment of the audience in that moment.
For more detail and insight, download Nielsen’s Global Trust in Advertising Report.
ABOUT THE NIELSEN GLOBAL SURVEY
The Nielsen Global Trust in Advertising Survey was conducted between Feb. 23 and March 13, 2015, and polled more than 30,000 consumers in 60 countries throughout Asia-Pacific, Europe, Latin America, the Middle East, Africa and North America. The sample has quotas based on age and sex for each country based on its Internet users and is weighted to be representative of Internet consumers. It has a margin of error of ±0.6%. This Nielsen survey is based only on the behavior of respondents with online access. Internet penetration rates vary by country. Nielsen uses a minimum reporting standard of 60% Internet penetration or an online population of 10 million for survey inclusion. The Nielsen Global Survey, which includes the Global Consumer Confidence Index, was established in 2005


