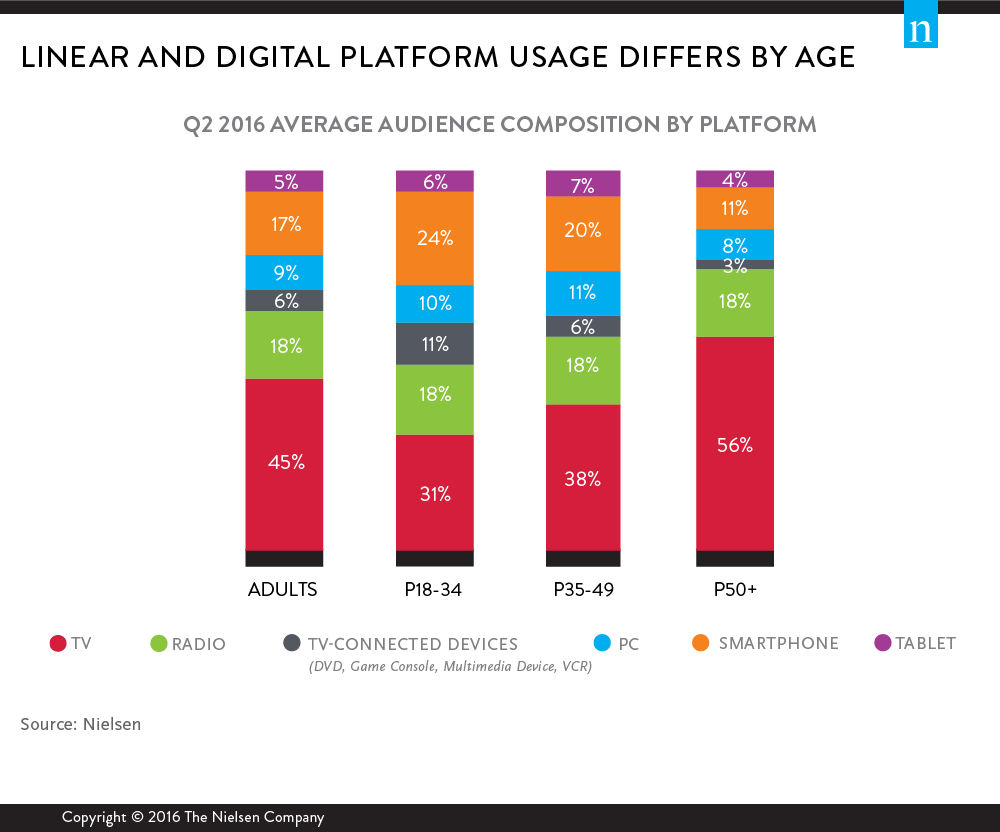
As we move further into the digital age, it should come as no surprise that our usage of mobile devices has become ubiquitous. As content consumption continues to evolve, it’s essential to look at the reach various devices have, how often consumers are using them and how long they’re doing so.
So how does usage stack up across platforms? According to Nielsen’s Q2 2016 Comparable Metrics Report, while TV is the most heavily consumed platform, digital devices are gaining steam with younger consumers. In fact, across linear and digital platforms, digital comprises 51% of the total average audience among persons 18-34.

Young adults also have a fondness for using TV-connected devices. When looking at time spent, persons 18-34 spend six hours and 40 minutes per week using TV-connected devices. Comparatively, adults 35-49 spend the most time per week on smartphones, PCs and tablets. When looking at the average days per week among users, adults 18 and older use TV-connected devices four days per week.
Black audiences watch more TV than any other group: They watch a total of 47 hours and 58 minutes per week. Hispanics are the most avid radio listeners, spending 13 hours and 52 minutes listening to radio each week, and they spend the most time using their smartphones (14 hours and 31 minutes per week). Asian-Americans have the highest amount of weekly TV-connected device usage for a total of four hours and 18 minutes.
For additional insights, download the second-quarter 2016 Nielsen Comparable Metrics Report.
