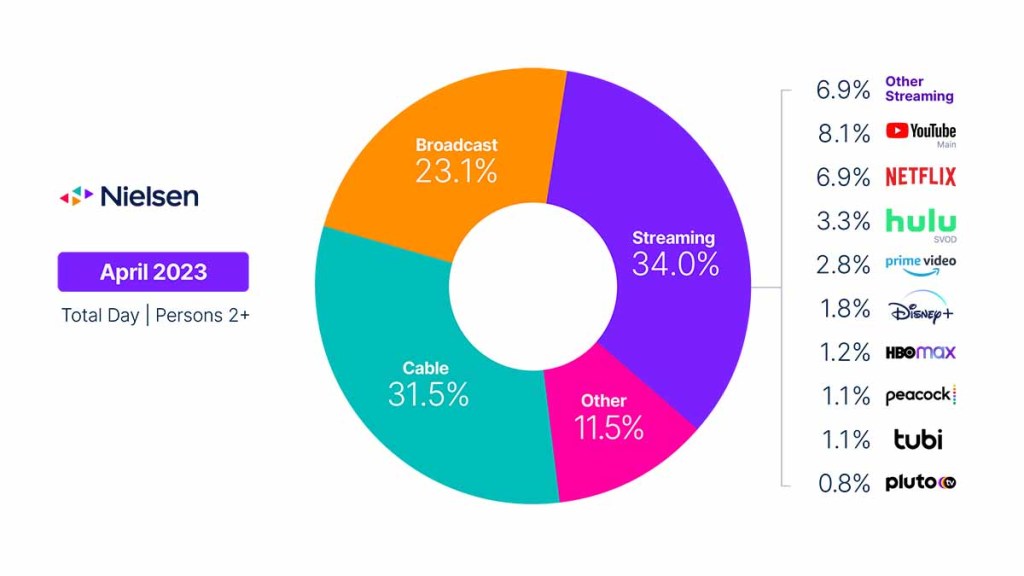
Total TV usage trended down another 1.9% in April, as is typical when the weather starts to warm up. Yet despite the drop in total usage, an active news cycle contributed to a second month of share gains for cable, which picked up 0.4 share points to account for 31.5% of TV usage. The gain represents the first back-to-back increase for cable since the launch of The GaugeTM in May 2021.
The strength of the news cycle helped cable remain largely stable from a usage perspective, as cable viewing was down just 0.6% from March. In fact, news was the only cable genre that didn’t experience a dip in usage. News viewing was up 4.3%, accounting for 19% of cable usage in April. Former President Trump’s court appearance in New York on April 4 fueled daily usage spikes of 93%, 44% and 39% on CNN, FOX News and MSNBC, respectively. On a year-over-year perspective, cable content viewership was down 12% (5.3 share points).
Broadcast usage dipped 2.7% in April, losing 0.2 share points to account for 23.1% of total TV use. The NCAA basketball tournament and The Masters golf tournament were the most-viewed broadcast programs, but sports viewing did slide 17.1% in aggregate to account for just 9.6% of the category. Dramas attracted a 2.1% viewing increase, driven by titles like NCIS, Blue Bloods and Chicago Fire. On a year-over-year perspective, broadcast viewing was down 3.7% (1.6 share points).
In the streaming space, competition is causing shifts in usage shares, while seasonality contributed to a 2.1% dip in viewing across the category. Netflix viewing, for example, dropped 7%, translating to a loss of 0.4 share point, despite having the top two programs from a viewing perspective: The Night Agent and Love is Blind. Comparatively, usage increased across the two newest free, ad-supported options in The Gauge: Tubi TV usage grew 6% and Pluto TV usage increased 3.9%. Other highlights:
- While Disney+ viewership was down 1.7%, The Mandalorian was the third-most streamed title in April.
- YouTube, excluding YouTube TV, remained the most-used platform, with usage increasing 1.5% to help the platform capture 8.1% of TV usage.
- Viewership to “other streaming” resulted in an increase of 0.1 share points in April, with multiple platforms inching toward the 1% threshold to be reported individually.
April data trends with Brian Fuhrer
Methodology and frequently asked questions
The Gauge provides a monthly macroanalysis of audience viewing behaviors across key television delivery platforms, including broadcast, streaming, cable and other sources. It also includes a breakdown of the major, individual streaming distributors. The chart itself represents monthly total television usage, broken out into share of viewing by category and by individual streaming distributors.
How is ‘The Gauge’ created?
The data for The Gauge is derived from two separately weighted panels and combined to create the graphic. Nielsen’s streaming data is derived from a subset of Streaming Meter-enabled TV households within the National TV panel. The linear TV sources (broadcast and cable), as well as total usage are based on viewing from Nielsen’s overall TV panel.
All the data is time period based for each viewing source. The data, representing a broadcast month, is based on Live+7 viewing for the reporting interval (Note: Live+7 includes live television viewing plus viewing up to seven days later for linear content).
What is included in “Other”?
Within The Gauge, “other” includes all other TV usage that does not fall into the Broadcast, Cable or Streaming categories. This primarily includes all other tuning (unmeasured sources), unmeasured video on demand (VOD), streaming through a cable set top box, audio streaming, gaming and other device (DVD playback) use. Because streaming via cable set top boxes does not credit respective streaming distributors, these are included in the “other” category. Crediting individual streaming distributors from cable set top boxes is something Nielsen continues to pursue as we enhance our Streaming Meter technology.
What is included in “other streaming”?
Streaming platforms listed as “other streaming” includes any high-bandwidth video streaming on television that is not individually broken out. Apps designed to deliver live broadcast and cable (linear) programming (VMVPD or MVPD applications like Sling TV or Charter/Spectrum) are excluded from “other streaming.”
Where does linear streaming contribute?
Linear streaming (as defined by the aggregation of viewing to vMVPD/MVPD apps) is excluded from the streaming category as the broadcast and cable content viewed through these apps credits to its respective category. This methodological change was implemented with the February 2023 interval.
What about live streaming on Hulu and YouTube?
Linear streaming via vMVPD apps (e.g., Hulu Live, YouTube TV) are excluded from the streaming category. ‘Hulu SVOD’ and ‘YouTube Main’ within the streaming category refer to the platforms’ usage without the inclusion of linear streaming.