
The benefits of advancing technology are seemingly endless. We can check the security of our homes from our phones, receive grocery deliveries by drone—even drive cars that can parallel park for us. Our TVs are becoming equally advanced, offering seemingly endless content choices across an ever-growing landscape of platforms and channels. Yet despite the many doors that smart TVs will open in the years ahead, they won’t—by themselves—be able to provide the media industry with an accurate view of who’s using them.
Smart TVs have taken over the TV aisle at your local big-box retailer. You’d be hard pressed to find a TV in a store today that isn’t internet enabled. And just like all connected devices, smart TVs add to a growing proliferation of user-generated data: Automatic content recognition (ACR) data is the technology that OEMs use to capture tuning on smart TVs. When combined with information that details representative, person-level behavior, these data sets significantly advance the science of audience measurement.
Given the wide adoption of smart TVs and the data they produce, it’s not surprising that an array of companies are looking to ACR data as a way to measure audiences. From a sheer scale perspective, the opportunity is very appealing. Yet as lucrative a data source as ACR is, it isn’t sufficient by itself to measure audiences, simply because it lacks the most important aspect there is in audience measurement: people. In addition to not being representative—or even aware if someone is actually watching what’s on the screen—ACR data has a critical validation flaw: It requires the device manufacturer to match the image on the screen with a reference image in order to determine what content is being displayed. So, the best way to unlock the true potential of ACR data is to calibrate it with data that reflects true person-level viewing behavior.
When working as designed, ACR technology monitors the images that are projected on the TV glass, and uses those images to infer what content is being displayed. The images that ACR serves act in many ways like a fingerprint of the content. But after collecting the “fingerprints,” the technology needs to determine which network or platform the image appeared on, as well as when it appeared. To make that determination, the technology needs to match the image on the screen with an image contained in a manufacturer-maintained reference library.
There are three possible outcomes when the technology attempts to make that match:
- The image matches a single entry in the reference library
- The image matches multiple entries in the reference library
- A matching image isn’t in the reference library
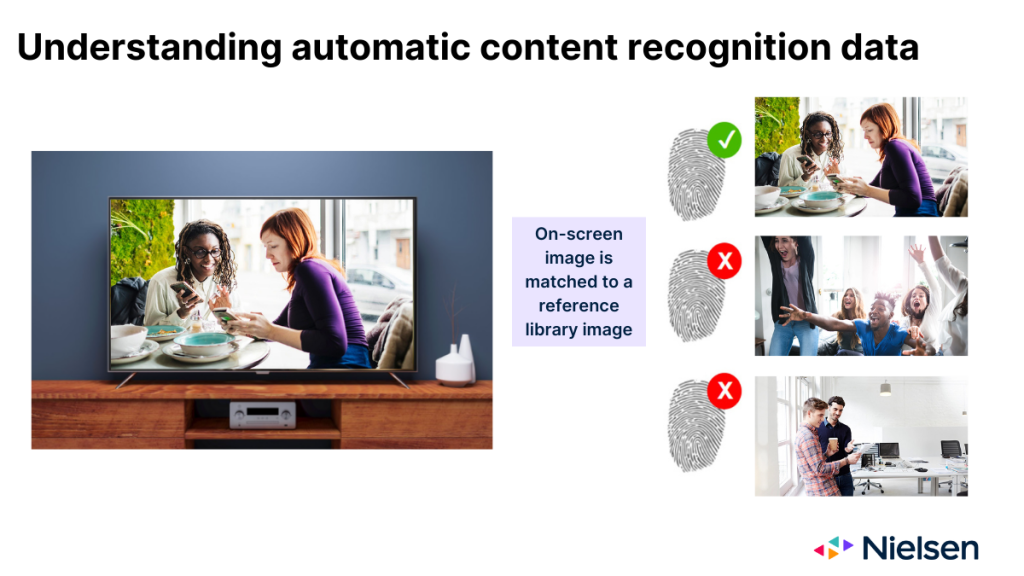
For all parties involved, the first outcome is the ideal scenario. The second scenario is less ideal, and it comes with some level of miscrediting risk, simply because of the various reasons for the multiple matches (e.g., airings across networks, repeat airings, simulcasts). In the third scenario, no one gets credit, which is obviously the least desirable scenario. The most common reason for this outcome is because the content aired on a network the OEM doesn’t monitor.
Even if image matching was a viable stand-alone measurement solution, the ability to leverage it as such would never be feasible. As you can imagine, the cost to maintain a library of every single frame of every event on television is no small task. It’s also a task that will grow exponentially in perpetuity. There are also no standard retention periods for images.
So how do we know the ACR technology will make the right match? Without a mechanism that can fill in the blanks, we don’t. That’s why Nielsen has invested in watermarks, which are far more deterministic than signatures, as well as signature backups for every measured feed. That provides representation of all content—filling in the gaps associated with the big data by itself. With these gaps filled, big data that comes from sources like ACR provide the benefit of scale in an increasingly segmented media landscape. And when we use weighting controls to calibrate big data with person-level viewing data, we are able to see comparison points that would otherwise be blank.
In a recent study, Nielsen looked to understand the degree to which these reference library gaps affect ACR tuning logs—the basis for ACR-based measurement. In a September 2021 common homes analysis, we analyzed data from our two ACR provider partners to understand where reference library gaps might factor into measurement. In our study, we looked at both the concentration of viewing sources and the viewed minutes from the available sources.
Across all viewing sources, we found that our ACR provider partners monitor just 31% of the available stations. That means they do not maintain data in their reference libraries for 69% of the stations. When we looked at minutes viewed, we found that 23% of minutes came from stations that are not monitored. That means companies leveraging ACR data alone for measurement would be undercounting household-level impressions by 23%.
Despite the limitations of ACR data on its own, we understand the opportunity of scale and reach that it provides as an additional source of coverage—similar to that of return path data (RPD) from set-top boxes, which our big data strategy also calibrates with panel data to address comparable limitations. By integrating big data sets with our viewing data, which provides representative measurement of the total U.S., we are able to significantly increase our sample sizes while applying rigorous data science methodologies to fill in the gaps and ensure fair representation of the total U.S. audience across all networks and platforms.
A version of this article originally appeared on AdExchanger.