Australian consumers are increasingly using their smartphone and tablet devices to be entertained, stay socially connected and access the latest information on the go. With over 15 million Australians now owning a smartphone and some 12 million owning a tablet device, it’s critical that the industry has access to quality mobile audience measurement data. To truly reach and engage with someone who’s anyone, you need to know consumers’ behaviours on mobile devices and understand how each screen type complements their broader engagement. It’s about adopting smarter ways to grow interactions and in turn, be able to quantify mobile marketing investments.
The latest edition of the IAB Australia and Nielsen Mobile Ratings Report revealed Australian smartphone owners spent 34 hours and 55 minutes during the month of August 2015 engaging with digital content – either via their smartphone’s web browser or via an installed application – averaging more than one hour per day. Time spent on a smartphone continues to grow and is now higher than any other digital device (43% of total time). Usage is typically characterised by short, frequent sessions – less than one third of the length of PC sessions on average at around nine to ten minutes per session – but more than three times as frequent. It is expected that this frequency will continue to surge.
MAKING THE MOST OF OUR MOBILE TIME
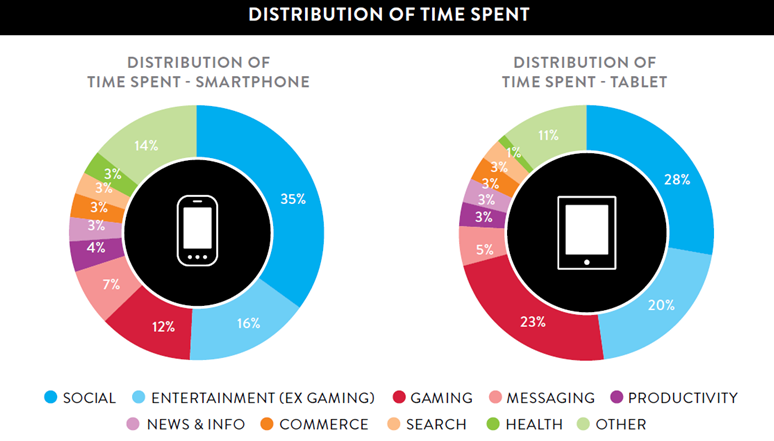
During August 2015, more than one-third (35%) of time spent by Australians on their smartphones was social networking, followed by entertainment (16%) and gaming (12%). Social (28%) still held the largest share of time spent on tablets; however, consumers spent more time with gaming (23%) and entertainment (20%) content compared to smartphones.
Social, video/movies, gaming, messaging, music, travel, finance and news & information categories all have larger audiences on smartphone than on a PC. Social, entertainment and gaming drive the most time spent on both smartphone and tablet devices.

ENTERTAIN, EDUCATE OR EXCITE ME – GETTING CONSUMER ATTENTION ON MOBILE
The entertainment category – which is the second biggest genre for time spent on both smartphones and tablets – includes a wide range of content, much of which drives very high duration. In August 2015, Australians spent almost 11 hours with entertainment-related content on smartphones and close to 12 hours on tablets. Compared to PC, the entertainment category has a significantly stronger active reach to smartphone owners – 94% vs 82%. Three sub-categories on smartphone and tablet are the key drivers of both time and reach for entertainment content – Video / Movies, Music and Gaming.
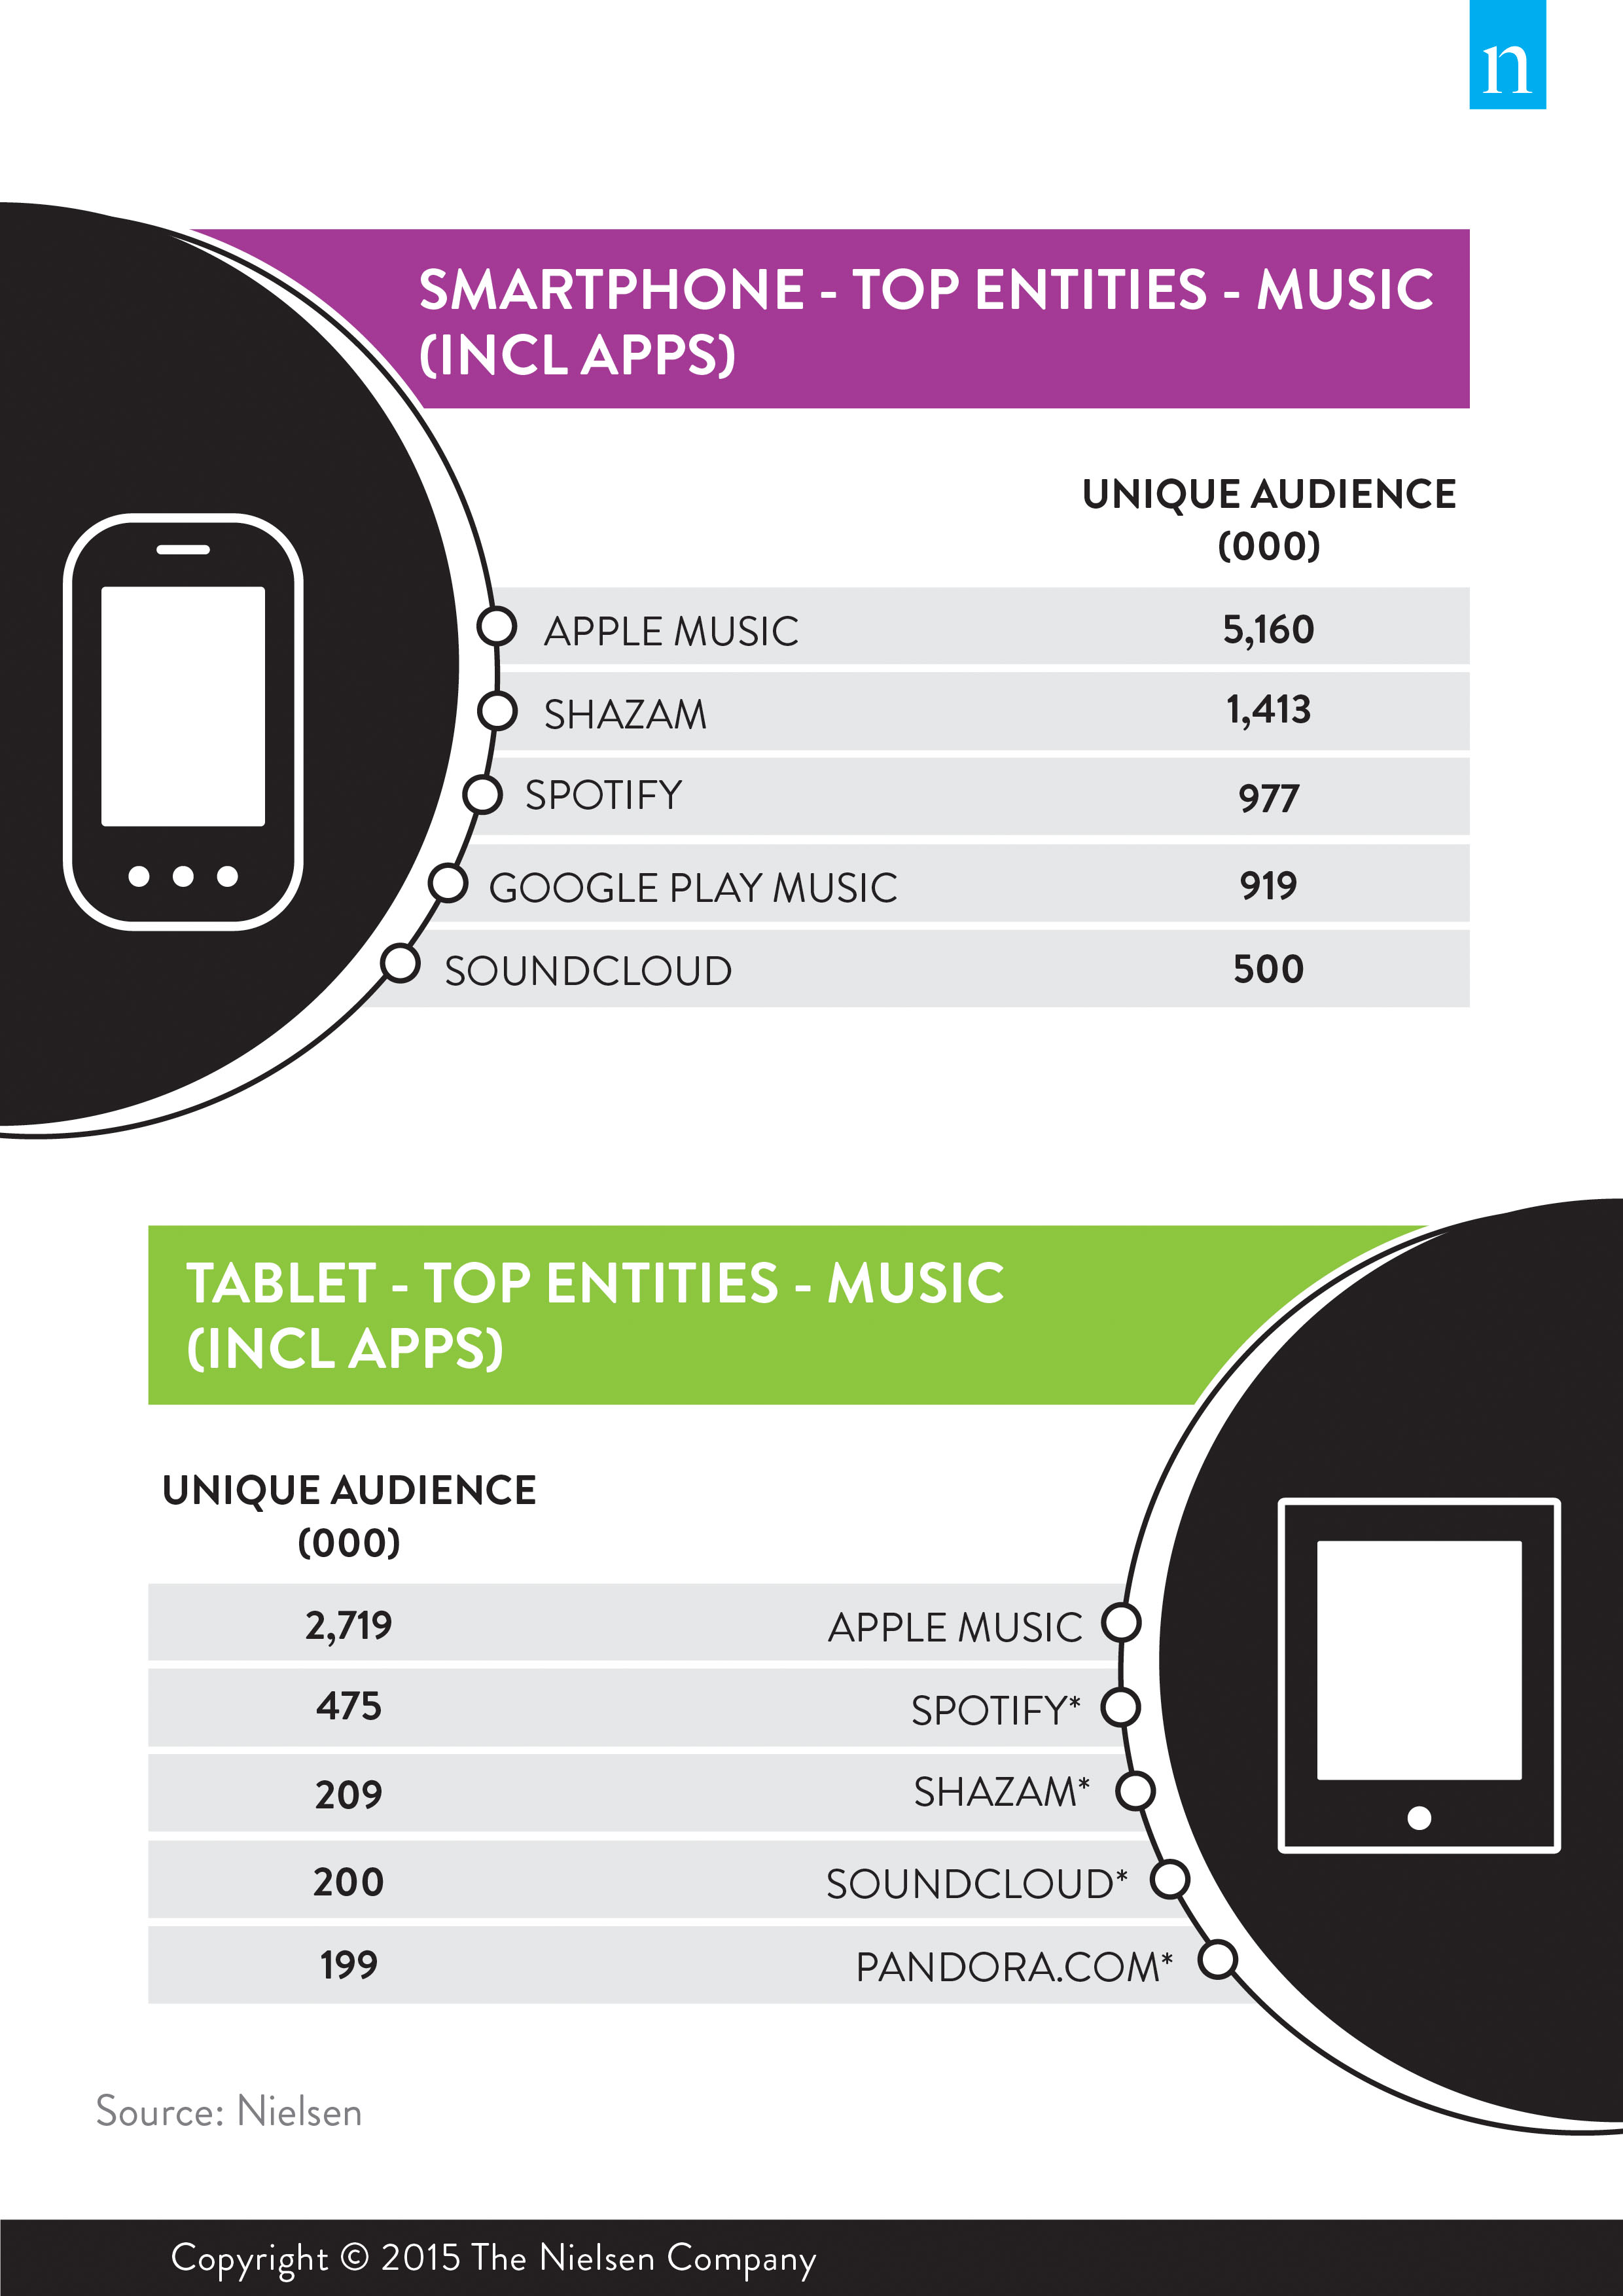
Music is the second largest driver of active reach and unique audience within the entertainment category (after Video / Movies). In August 2015, 8.2 million Australians listened to music or viewed music-related content on their smartphone and 3.7 million did the same on tablets. Apple Music, Shazam and Spotify are the leaders on both smartphones and tablets in terms of the biggest unique audiences.

Note: Entities marked with an asterisk (*) do not meet minimum sample size standards and may exhibit significant variability month-to-month.
CURRENT EVENTS & GLOBAL NEWS CATEGORY
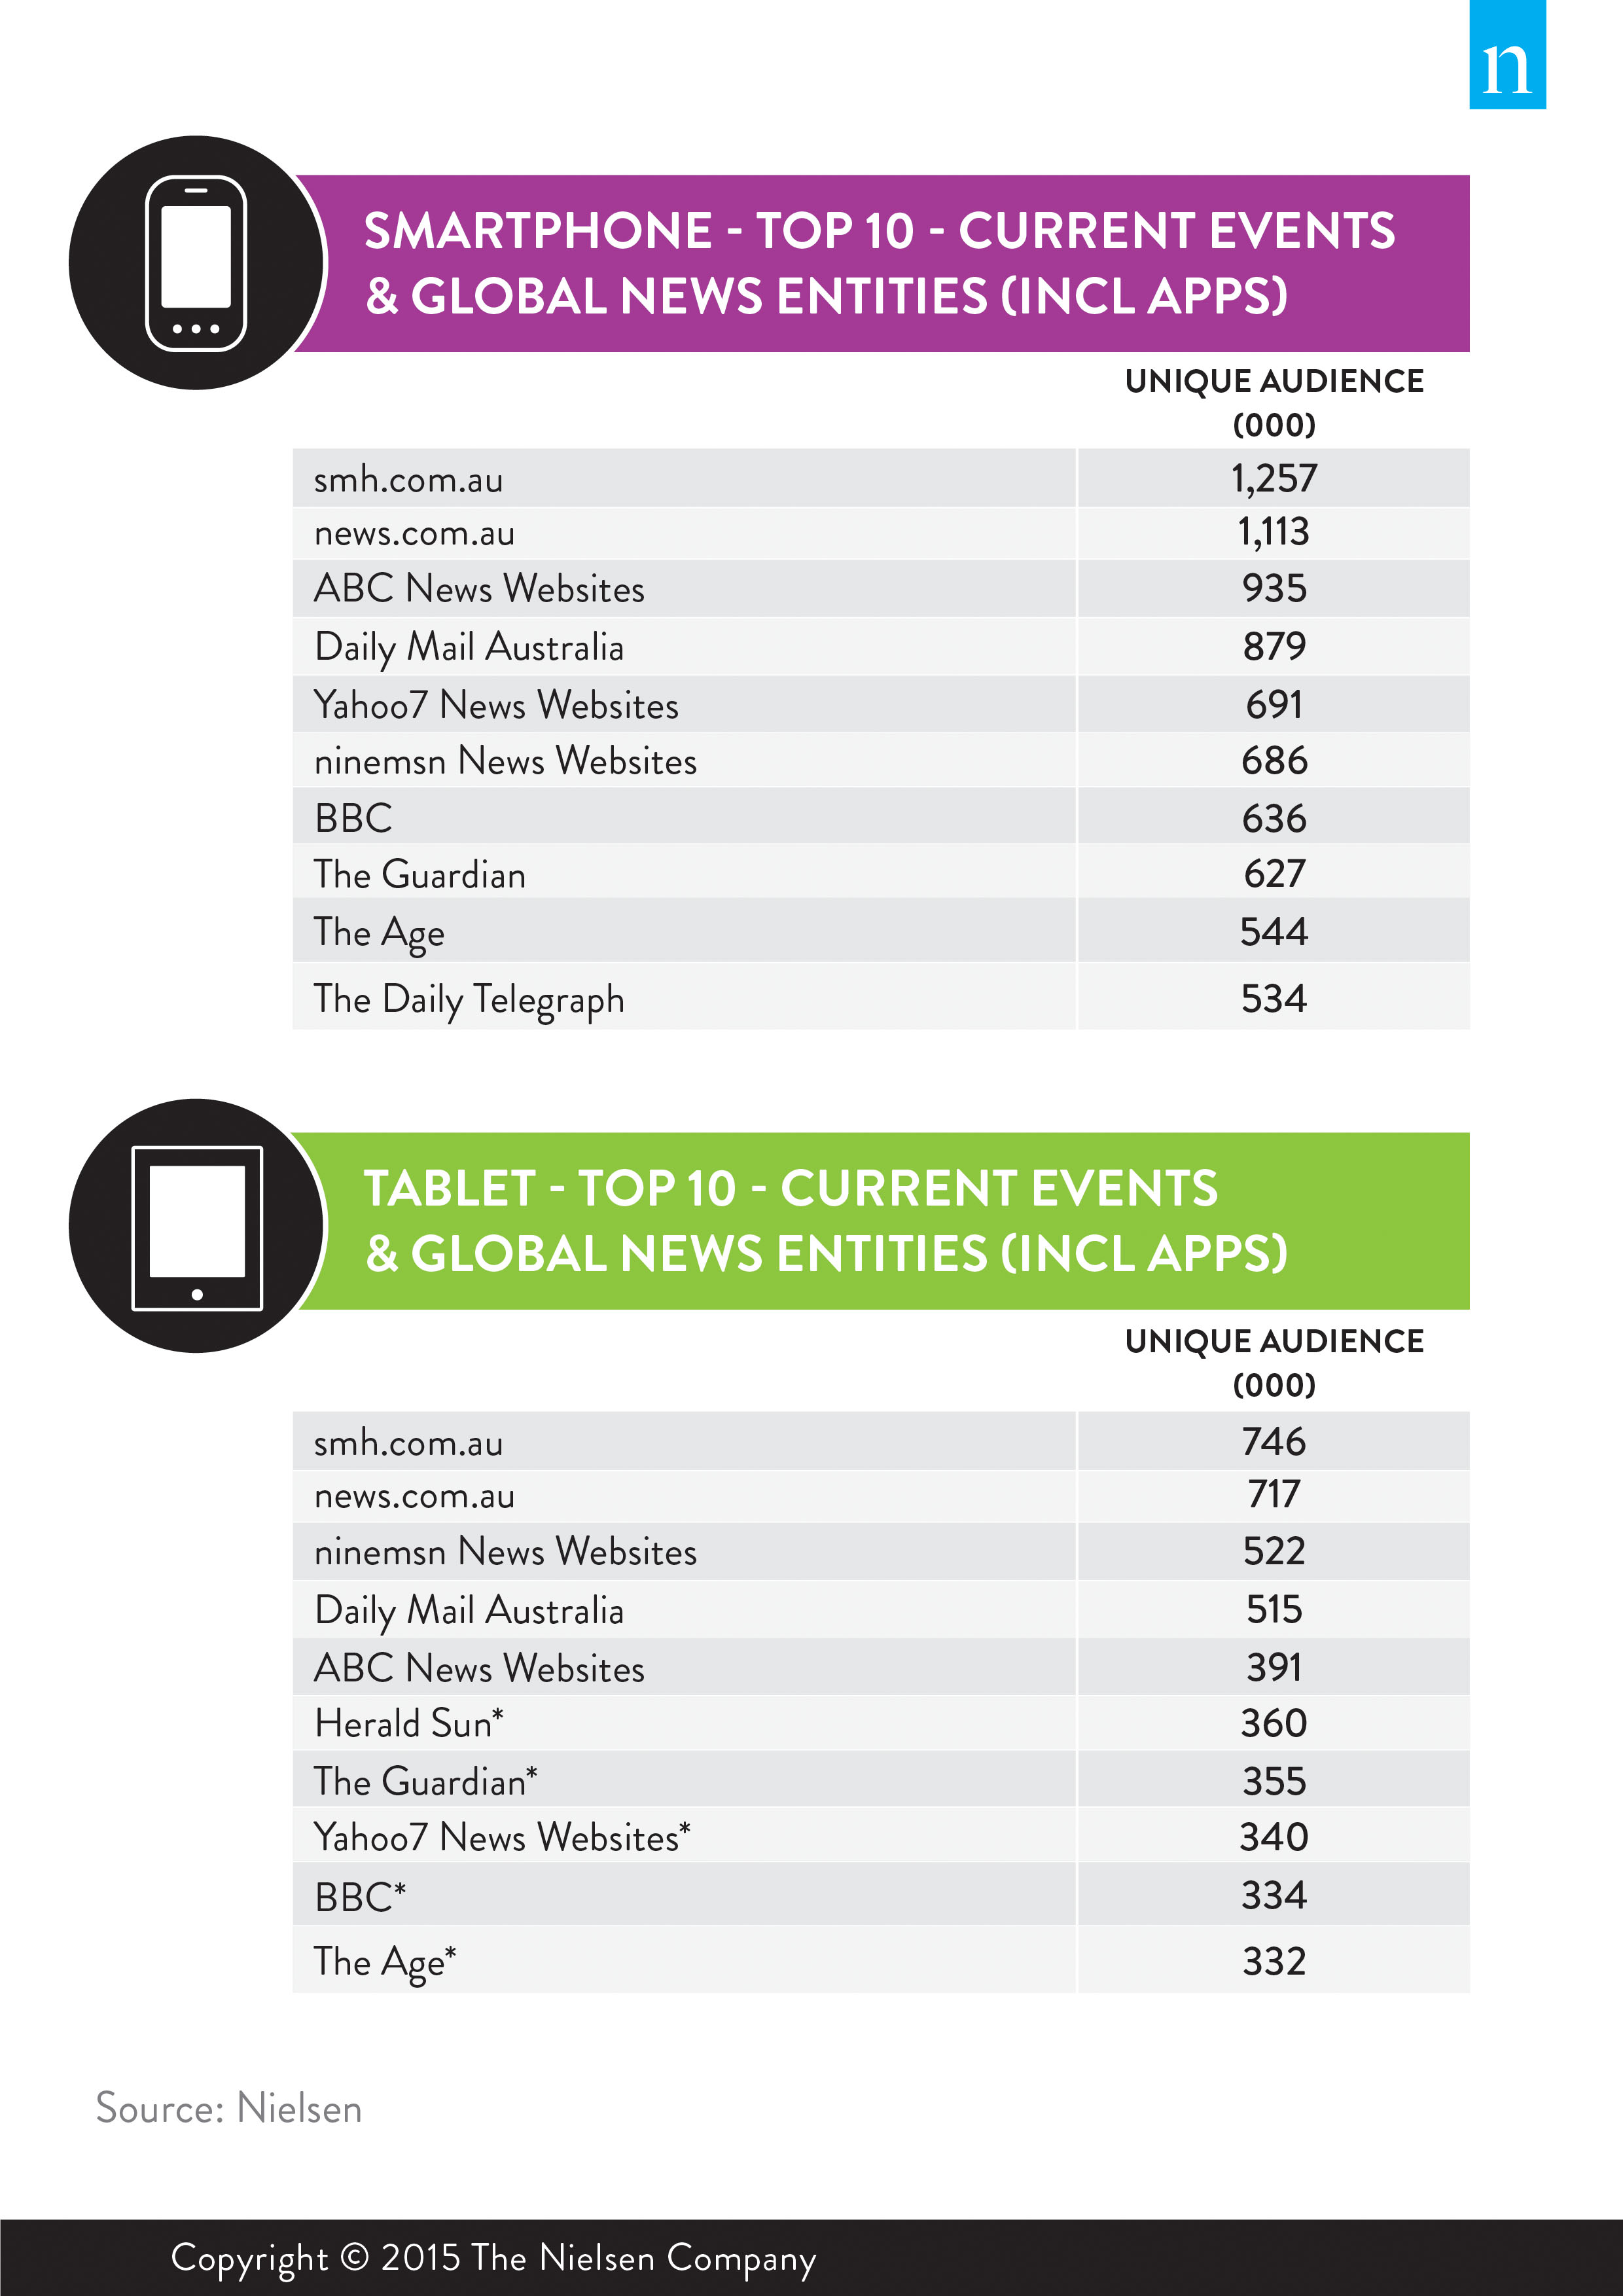
Australians 18+ now consume more news & information content on their smartphone than on a tablet or PC. Both the smartphone and tablet rankings for the current events & global news subcategory are dominated by the same brands that have historically been strong in PC ratings. For the month of August 2015, smh.com.au topped the news rankings on both smartphone and tablet devices in terms of the largest unique audience to their site or app.
News & information is one of the most popular genres on PC in Australia and this is translating well to smartphones. However, when reviewing habits in the U.S. market, there is still considerable upside for this category in the Australian market with only 43% reach in Australia compared with 54% in the U.S.

Note: Entities marked with an asterisk (*) do not meet minimum sample size standards and may exhibit significant variability month-to-month.
Understanding which devices your consumers are on and the combinations of usage across devices can be really important in terms of designing the total consumer experience campaign with a brand.
The Nielsen Australian Connected Consumers Report revealed that three out of four online Australians engage in ‘multi-screening’ behaviour. A staggering 81% of these multi-screeners were accessing something relevant on their mobile devices to what they were watching on the big screen. And more than half were actively using their companion device to look up products and services that were advertised on the main screen.
The implication here is that brands investing in one medium or another – whether it is content production or advertising – must consider the full range of digital engagement by consumers. It’s important to know these audiences and think about these combinations and the contexts for how the consumer arrives at that interaction and reaction.
The August 2015 Nielsen Mobile Rating Report is the second edition of preview data released to the Australian market by IAB Australia and Nielsen. The report is the first phase of major upgrades to the digital audience measurement system in Australia. In early 2016 the Mobile Ratings Report will be replaced by Digital Ratings Monthly which will fuse smartphone and tablet panel data with Nielsen’s home/work PC panel data and tagged website data. Digital Ratings Monthly will be the base for further development which will see Nielsen transition to daily delivery of digital audience data through Digital Content Ratings, which is slated for launch in mid-2016.
The results are based on the mobile panel which consists of 2,000 iOS and Android smartphone users and 500 iOS and Android tablet users aged 18+. This panel is nationally representative of Australian smartphone and tablet internet users, has individual privacy agreements in place with all panellists and passively measures the online behaviour of panellists on their mobile device through an on-device meter (Android) or proxy solution (iOS). The panels provide granular data on a monthly basis that can be used by media buyers and sellers to better understand the mobile consumer and assess the opportunities available in what is now a significant media channel. It includes audiences from both web browsers on mobile devices and for the first time, mobile applications.
As the Nielsen Mobile Ratings report uses preview data based on a panel-only methodology, variation in unique audiences from month-to-month may occur. The Mobile Ratings preview data will display more variation in monthly metrics than the established Nielsen Online Ratings currency and is unsuitable for trading.


