Keeping track of consumers’ media diets is a daunting challenge for any marketer. Thankfully it’s less challenging when media consumption can be sliced and diced across multiple platforms to see how Americans are spending their media days in an age of overwhelming choice. And the astounding choice is actually driving increased media consumption. According to our most recent Nielsen Total Audience report, the average U.S. consumer has added an hour of daily media usage over the past two years.
And as the media world changes the patterns and tendencies of consumers everywhere, we’re finding more and more examples of why it’s important to judge each platform by the three basic cross-platform tenets: how many people use each platform, how often do they do so and how long do they stay.
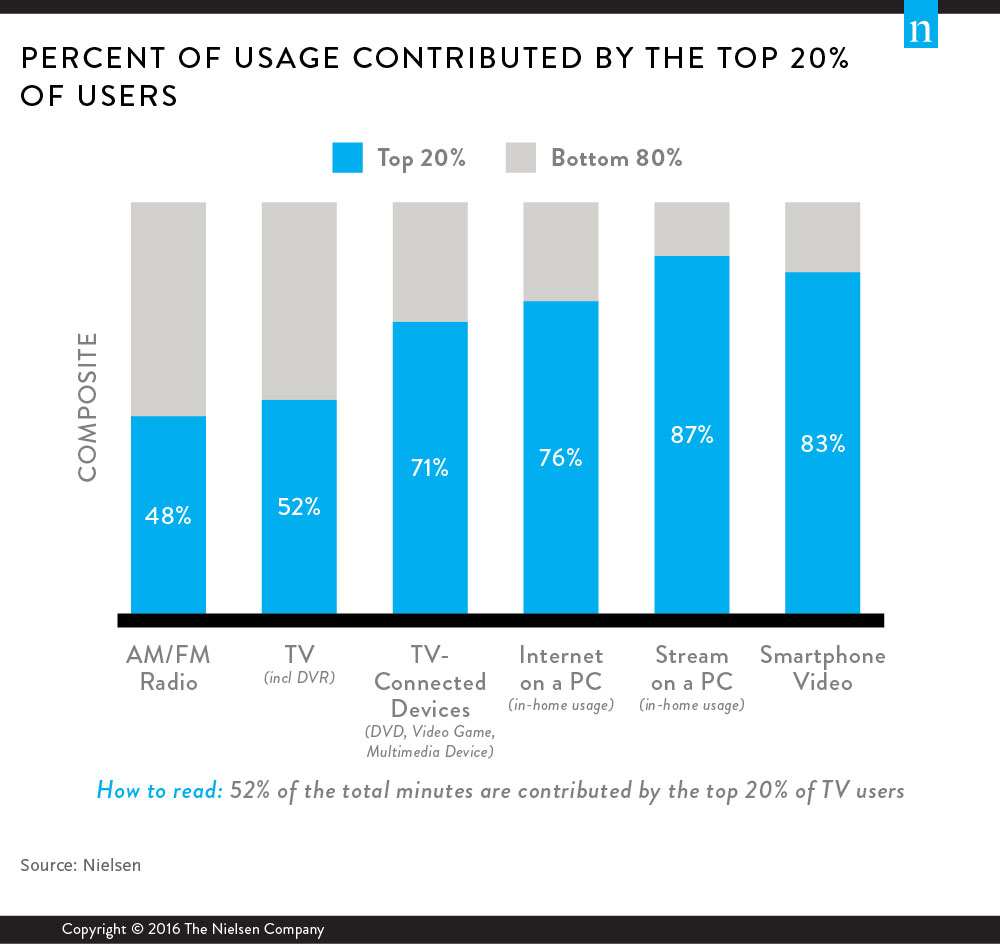
More so than other factors, these three basic elements (which can also be categorized as reach, frequency and time spent) affect how engagement on each platform looks when it’s gauged by the discerning eye of deep-dive analysis. This can be especially enlightening when you scale your analysis according to the “Pareto Principle,” which, in the media realm, states that 20% of the media-consuming public drives 80% of consumption. For example, for the first-quarter Nielsen Total Audience report, we investigated the impact of the top 20% of users for each medium to see just how much of the total time spent with each platform they contributed.

Two things stand out from this analysis. First, it’s clear that larger, more widespread behaviors (those that simply reach more people) are less concentrated among the heaviest users. There are simply more overall users, so the impact of the top group is not as evident. And conversely, smaller behaviors (those that reach less people) done by fewer people tend to be more concentrated among the heaviest users.
But secondly–and most importantly for advertisers considering the right media mix–this data hints at the implications of placing a campaign on one particular platform over another, and who will be affected by that message. For AM/FM radio as well as live and time-shifted television (the top two platforms for monthly reach), the top group of users drive a much lower percentage of the total usage. This means that a message heard or seen on radio and TV will reach more individual consumers overall, as compared to those who reach consumers online or on a smartphone. When the top 20% of users account for a large majority of the total usage, that smaller group will simply be more likely to be reached again and again. This is in contrast to the large number of impressions that can be achieved using the mass-appeal mediums such as radio and TV.


