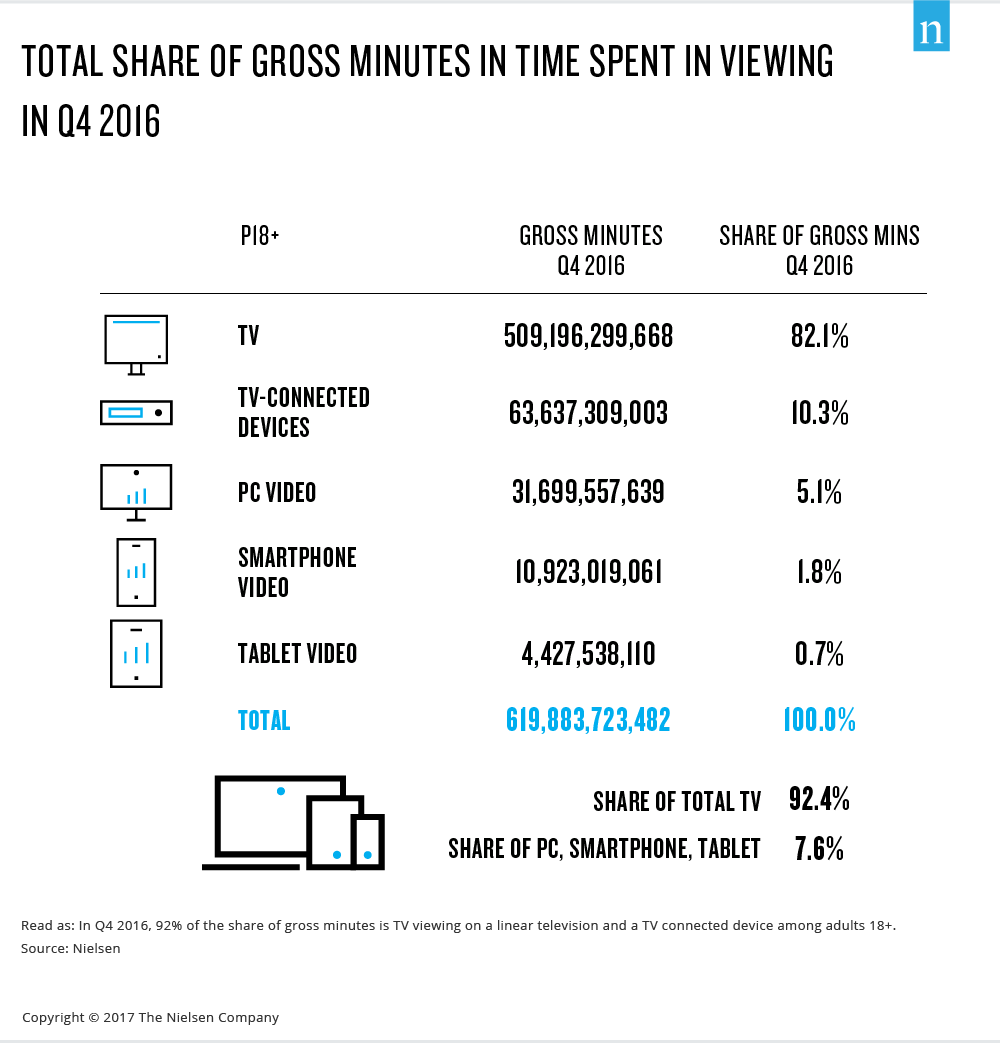
A new analysis of insights from Nielsen’s fourth-quarter 2016 Comparable Metrics Report found that over 92% of all viewing among U.S. adults (18+) happens on the TV screen.
The analysis, which leverages Nielsen’s gold-standard data, focused on the share of total gross minutes of consumer viewing across TVs and TV-connected devices in addition to PC, smartphone and tablet video in fourth-quarter 2016.
While different viewing options continue to proliferate the viewing landscape, the analysis looked comparably at popular viewing platforms and found that all adult consumers still rely on the TV screen for the lion’s share of their overall viewing.
“The fact of the matter is that viewers use the TV screen for the bulk of their viewing and spend more time doing so than all the other platforms combined,” said Tom Ziangas, SVP Research at AMC Networks. “Sure, viewers have more options today, but when looking at platforms in a comparative fashion, it’s clear that consumers choose the television as the primary vehicle for content,” he added.

Nielsen’s Comparable Metrics Report series is an in-depth study of users and usage–averaged across the U.S. population–with the purpose of aligning methodologies and metrics to display an “apples to apples” view of consumption across TV, Radio, TV-connected devices, PCs, smartphones and tablets.
“This analysis is based on actual, behavioral data and that is what makes Nielsen an industry leader. What we found was that contrary to the popular narrative that smaller screens were taking away time from the TV glass, when we looked deeper we found that overall time spent viewing on the TV had the most minutes among every age or ethnic demographic looked at. In some cases the share of viewing was as much as 97%,” said Peter Katsingris, SVP Audience Insights, Nielsen.


