With increasing media fragmentation, understanding audiences is essential to determining effective content distribution strategies. Nielsen’s first quarterly Content Ratings Benchmarks report explores how audiences are connecting, on average, with video content across live TV, DVR, VOD and digital platforms. Drawing from Digital Content Ratings and Total Content Ratings data, the report provides a comprehensive view of how individuals consume video content using comparable metrics to evaluate consumption across TV and digital.
Of the myriad ways viewers consume TV-originated content, Nielsen found that live TV continues to be the largest contributor to time spent. Within the 18-34 demographic, 66% of the time they spend watching content from the four leading broadcast networks occurs through live TV viewing. When consuming content originated from cable networks, this same group spends 81% of their time viewing this content on live TV.
Content consumption through connected TV devices continues to grow, bringing together both linear and dynamic content in an enhanced living room experience. Americans, on average, spend 4.3 billion minutes watching VOD content from the four leading broadcast networks through a connected device.
Looking closer at how people spend their time watching content on mobile devices, smartphones and tablets have become significant vehicles for content originated on broadcast and cable networks, as well as content originated from digital-first publishers.
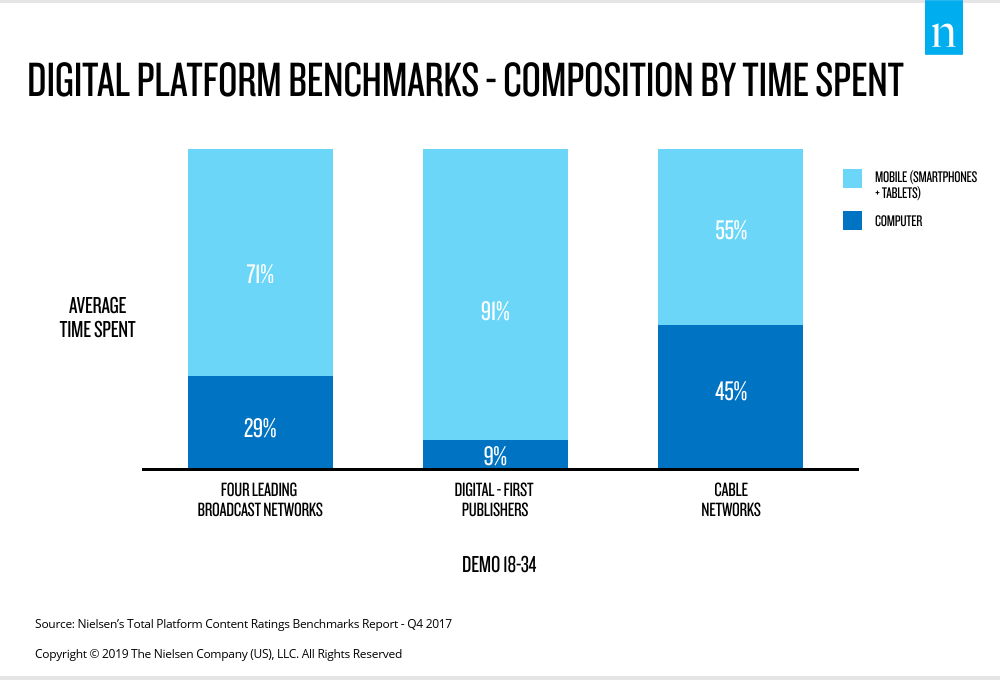
Among the time that people 18-34 spend watching broadcast originated content on digital devices*, 71% of that viewing is spent on smartphones and tablets instead of computers. On the other hand, data shows among the time that people 18-34 spend watching content originated from cable networks on digital devices, 55% of that viewing is spent on mobile devices instead of computers. When specifically looking at consumption of content originated from digital-first publishers, 91% of the time spent on a digital device by the 18-34 demographic occurs on mobile devices.
Understanding how people are spending their time and where they are viewing is essential to monetizing content and creating value for media owners and buyers alike.
Note
*Digital devices refers to computers (PC, laptop, etc.) and mobile devices (smartphone, tablet, etc.).
Methodology
The insights in this article were derived from the following sources:
- Nielsen’s Total Platform Content Ratings Benchmarks Report – Q4 2017; TV ratings (Live/DVR), VOD (VOD in TV Ratings, VOD Content Ratings) and digital (Digital in TV ratings/Digital Content Ratings census) data reporting in Total Content Ratings and Digital Content Ratings. Composition calculation base is the sum of all component platform time spent benchmarks across day-parts.
