The arrival of new broadcast programming had a significant impact on television viewing in October, which grew by 2.2% in overall usage compared to September, but not enough to alter the continued momentum of streaming.
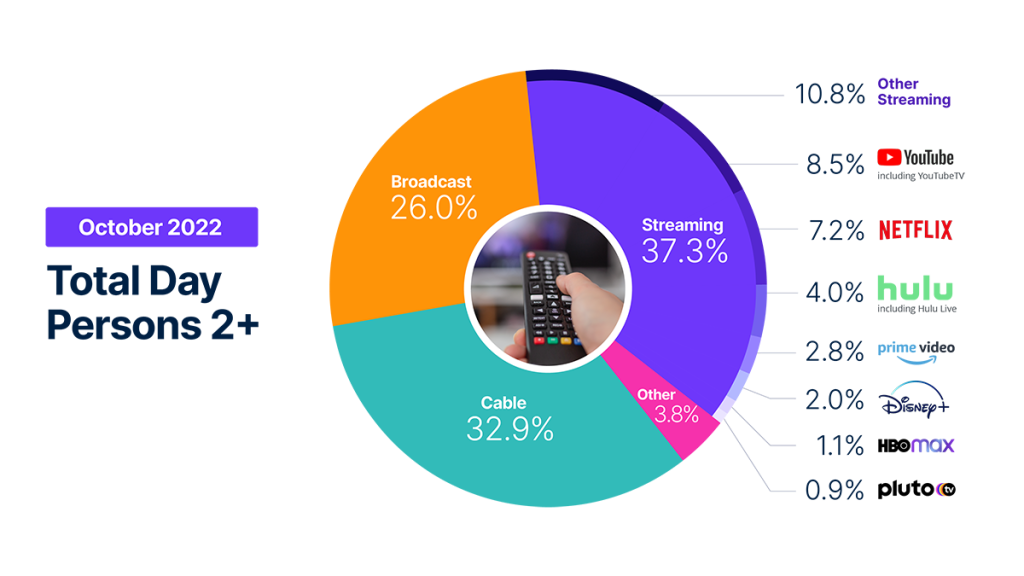
Following the September arrival of a new football season, the influx of new fall programming across broadcast channels in October resulted in a 9.8% jump in viewing, boosting broadcast’s share of total TV usage to 26% (up from 24.2% in September). Sports continued to attract big audiences (19% gain in viewing volume), but the general drama category leapfrogged sports with a 42% rise in viewing volume to account for 26.7% of broadcast viewing. Despite the gains, however, broadcast usage during the month was down 6.2% from a year ago.
Having maintained more than one-third of total TV usage since June 2022, streaming usage continued to grow in October, but at a much slower pace (3.3% in usage; 0.4 share point). After a busy summer of new content across streaming services, viewership share remained largely consistent in October, but there were a few notable upticks in usage from September:
- Disney+ usage increased 6.8%
- Hulu usage increased 5%
- YouTube usage increased 8.3%
The continued introduction of new content across platforms speaks to how different services are succeeding simultaneously. Specifically, the top five programs in October (per minutes viewed: Dahmer, The Watcher, Hocus Pocus 2, House of The Dragon and Lord of the Rings: Rings of Power) spanned four different platforms (Netflix, Disney+, HBO Max, and Amazon Prime Video). And engagement with programming like this highlights why streaming usage is up 35.1% from October 2021.
Viewing of linear television MVPD (multichannel video programming distributors) and vMVPDs (virtual multichannel video programming distributors) apps represented 5.7% of total television usage and 15.4% of streaming usage in October. Broadcast and cable content viewed through linear streaming apps also credits its respective category.
Compared with broadcast and streaming, cable viewing was fairly flat in October, with usage down 0.7% from September. News remained the largest driver of cable viewing (19.6%) and increased 3.3% during the month, while sports was the biggest mover, jumping 25% to represent 9.6% of all cable viewing. On an annual basis, cable viewing is down 8.6% in usage and 4.1 share points.
Methodology and frequently asked questions
The Gauge provides a monthly macroanalysis of how consumers are accessing content across key television delivery platforms, including broadcast, streaming, cable and other sources. It also includes a breakdown of the major, individual streaming distributors. The chart itself shows the share by category and of total television usage by individual streaming distributors.
How is ‘The Gauge’ created?
The data for The Gauge is derived from two separately weighted panels and combined to create the graphic. Nielsen’s streaming data is derived from a subset of Streaming Meter-enabled TV households within the National TV panel. The linear TV sources (broadcast and cable), as well as total usage are based on viewing from Nielsen’s overall TV panel.
All the data is based on a time period for each viewing source. The data, representing a broadcast month, includes a combination of Live+7 viewing for the reporting interval (Note: Live+7 includes live television viewing plus viewing up to seven days later for linear content).
What is included in “Other”?
Within The Gauge, “other” includes all other TV. This primarily includes all other tuning (unmeasured sources), unmeasured video on demand (VOD), streaming through a cable set top box, gaming and other device (DVD playback) use. Because streaming via cable set top boxes does not credit respective streaming distributors, these are included in the “other” category. Crediting individual streaming distributors from cable set top boxes is something Nielsen continues to pursue as we enhance our Streaming Meter technology.
What is included in “other streaming”?
Streaming platforms listed as “other streaming” includes any high-bandwidth video streaming on television that is not individually broken out.
Where does linear streaming contribute?
Linear streaming (as defined by the aggregation of viewing to vMVPD/MVPD apps) are included in the streaming category and represented 5.7% of total television in October 2022. Broadcast and cable content viewed through these apps also credits to its respective category.
Do you include live streaming on Hulu and YouTube?
Yes, Hulu includes viewing on Hulu Live and YouTube includes viewing on YouTube TV.
Encoded Live TV, aka encoded linear streaming, is included in both the broadcast and cable groups (linear TV) as well as under streaming and other streaming e.g., Hulu Live, YouTube TV, Other Streaming MVPD/vMVPD apps. (Note: MVPD, or multichannel video programming distributor, is a service that provides multiple television channels. vMVPDs are distributors that aggregate linear (TV) content licensed from major programming networks and packaged together in a standalone subscription format and accessible on devices with a broadband connection.)