For TV audiences, there’s no time like the fall. Yet as streaming gains momentum with viewers and the media, it’s easy to lose sight of the immense engagement that new primetime programming commands on traditional TV channels.

Amid the sea of choice, primetime programming remains a significant driver of viewership. Across the four primary English broadcast networks in the U.S.1, the 224 primetime programs in September attracted an average of 3.9 million viewers2 for live and same-day viewing. When we factor in time-shifted viewing for the full week, the average audience increases by 41% to 5.5 million.
For the fall season, these four networks debuted seven new primetime dramas in September—a mere drop in the bucket among the more than 923,000 unique video titles3 audiences have access to across linear channels and streaming platforms. That fact notwithstanding, these seven shows attracted a total of 25.5 million viewers during live and same-day viewing and 39.2 million for a week’s worth of time-shifted viewing2. They also did so as streaming claimed 36.9% of total TV usage.

There is no mistaking the trajectory of the streaming industry, especially as linear streaming4 represented 5.4% of total TV in September, but the majority of the U.S. TV audience has yet to cut the cord. As of September 2022, 51.5% of U.S. households watch TV using set-top-boxes from traditional cable and satellite providers5. And from a time spent perspective, audiences spend twice as much time with live and time-shifted programming as they do with their connected TV devices.
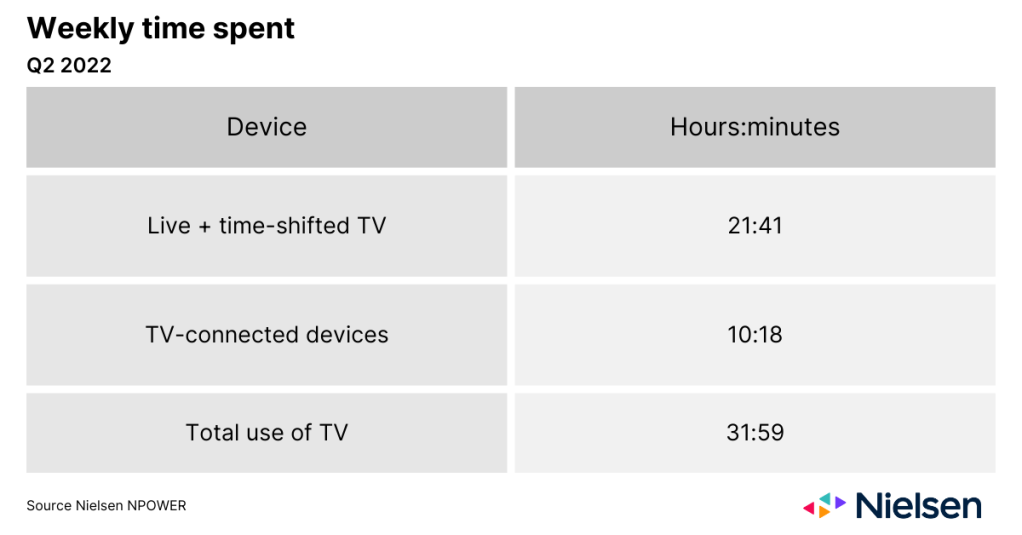
For fall TV, time-shifted viewing has become critical. While U.S. adults only spend an average of three hours and 43 minutes per week6 watching time-shifted TV, the seven new primetime network dramas that debuted this September attracted 54% of their total audience viewership in the six-day period after they aired.
Between Sept. 19, 2022, and Oct. 16, 2022, there were 21 individual episodes of these seven titles. In total, these episodes attracted 25.5 million viewers who tuned in live or watched on the same day the episodes aired. Over a seven-day period, however, the audience totals grew to 40.3 million.
The significant lift that seven-day viewing provides aligns with audiences’ move away from appointment viewing while highlighting the appeal of traditional network programming. But this programming is no longer solely available through traditional, linear options. Content distributors are increasingly making new primetime content available through multichannel video programming distributor (MVPD) apps and virtual MVPDs, which are both gaining momentum with audiences. In September 2022, linear streaming across these options accounted for 14.5% of all streaming7.
The impact of time-shifted viewing is also noteworthy when we factor in the declining percentage of U.S. TV households that watch TV using set-top-boxes from traditional cable and satellite providers. DVR ownership is also declining. In fact, only 39% of American households report owning one, down from 43.4% in September 20215.
In addition to appealing to millions of viewers, primetime television provides advertisers and agencies with a channel that remains well regarded from a trust and influence perspective. According to Nielsen’s most recent Trust in Advertising study, 67% of U.S. consumers say they completely or somewhat trust ads they see on TV, and 58% report taking action at least sometimes after seeing them.
Audiences now have seemingly endless choice across an ever-growing landscape of platforms and channels. And while The Gauge, Nielsen’s total TV viewing snapshot, continues to highlight viewers’ increasing appetites for streaming content, new primetime broadcast programming remains a huge draw, especially through the lens of live + 7-day viewing. The impact of this programming is perhaps even greater when we consider the declining number of cable+ households and dwindling DVR ownership among TV audiences.
Notes
- ABC, CBS, NBC, FOX
- Nielsen NPOWER, Sept. 19, 2022-Oct. 16, 2022
- Gracenote Global Video Data
- Traditional TV programming accessed online through an app or vMVPD
- Nielsen NPOWER
- Nielsen NPOWER, Q2 2022
- The Gauge, September 2022 usage data