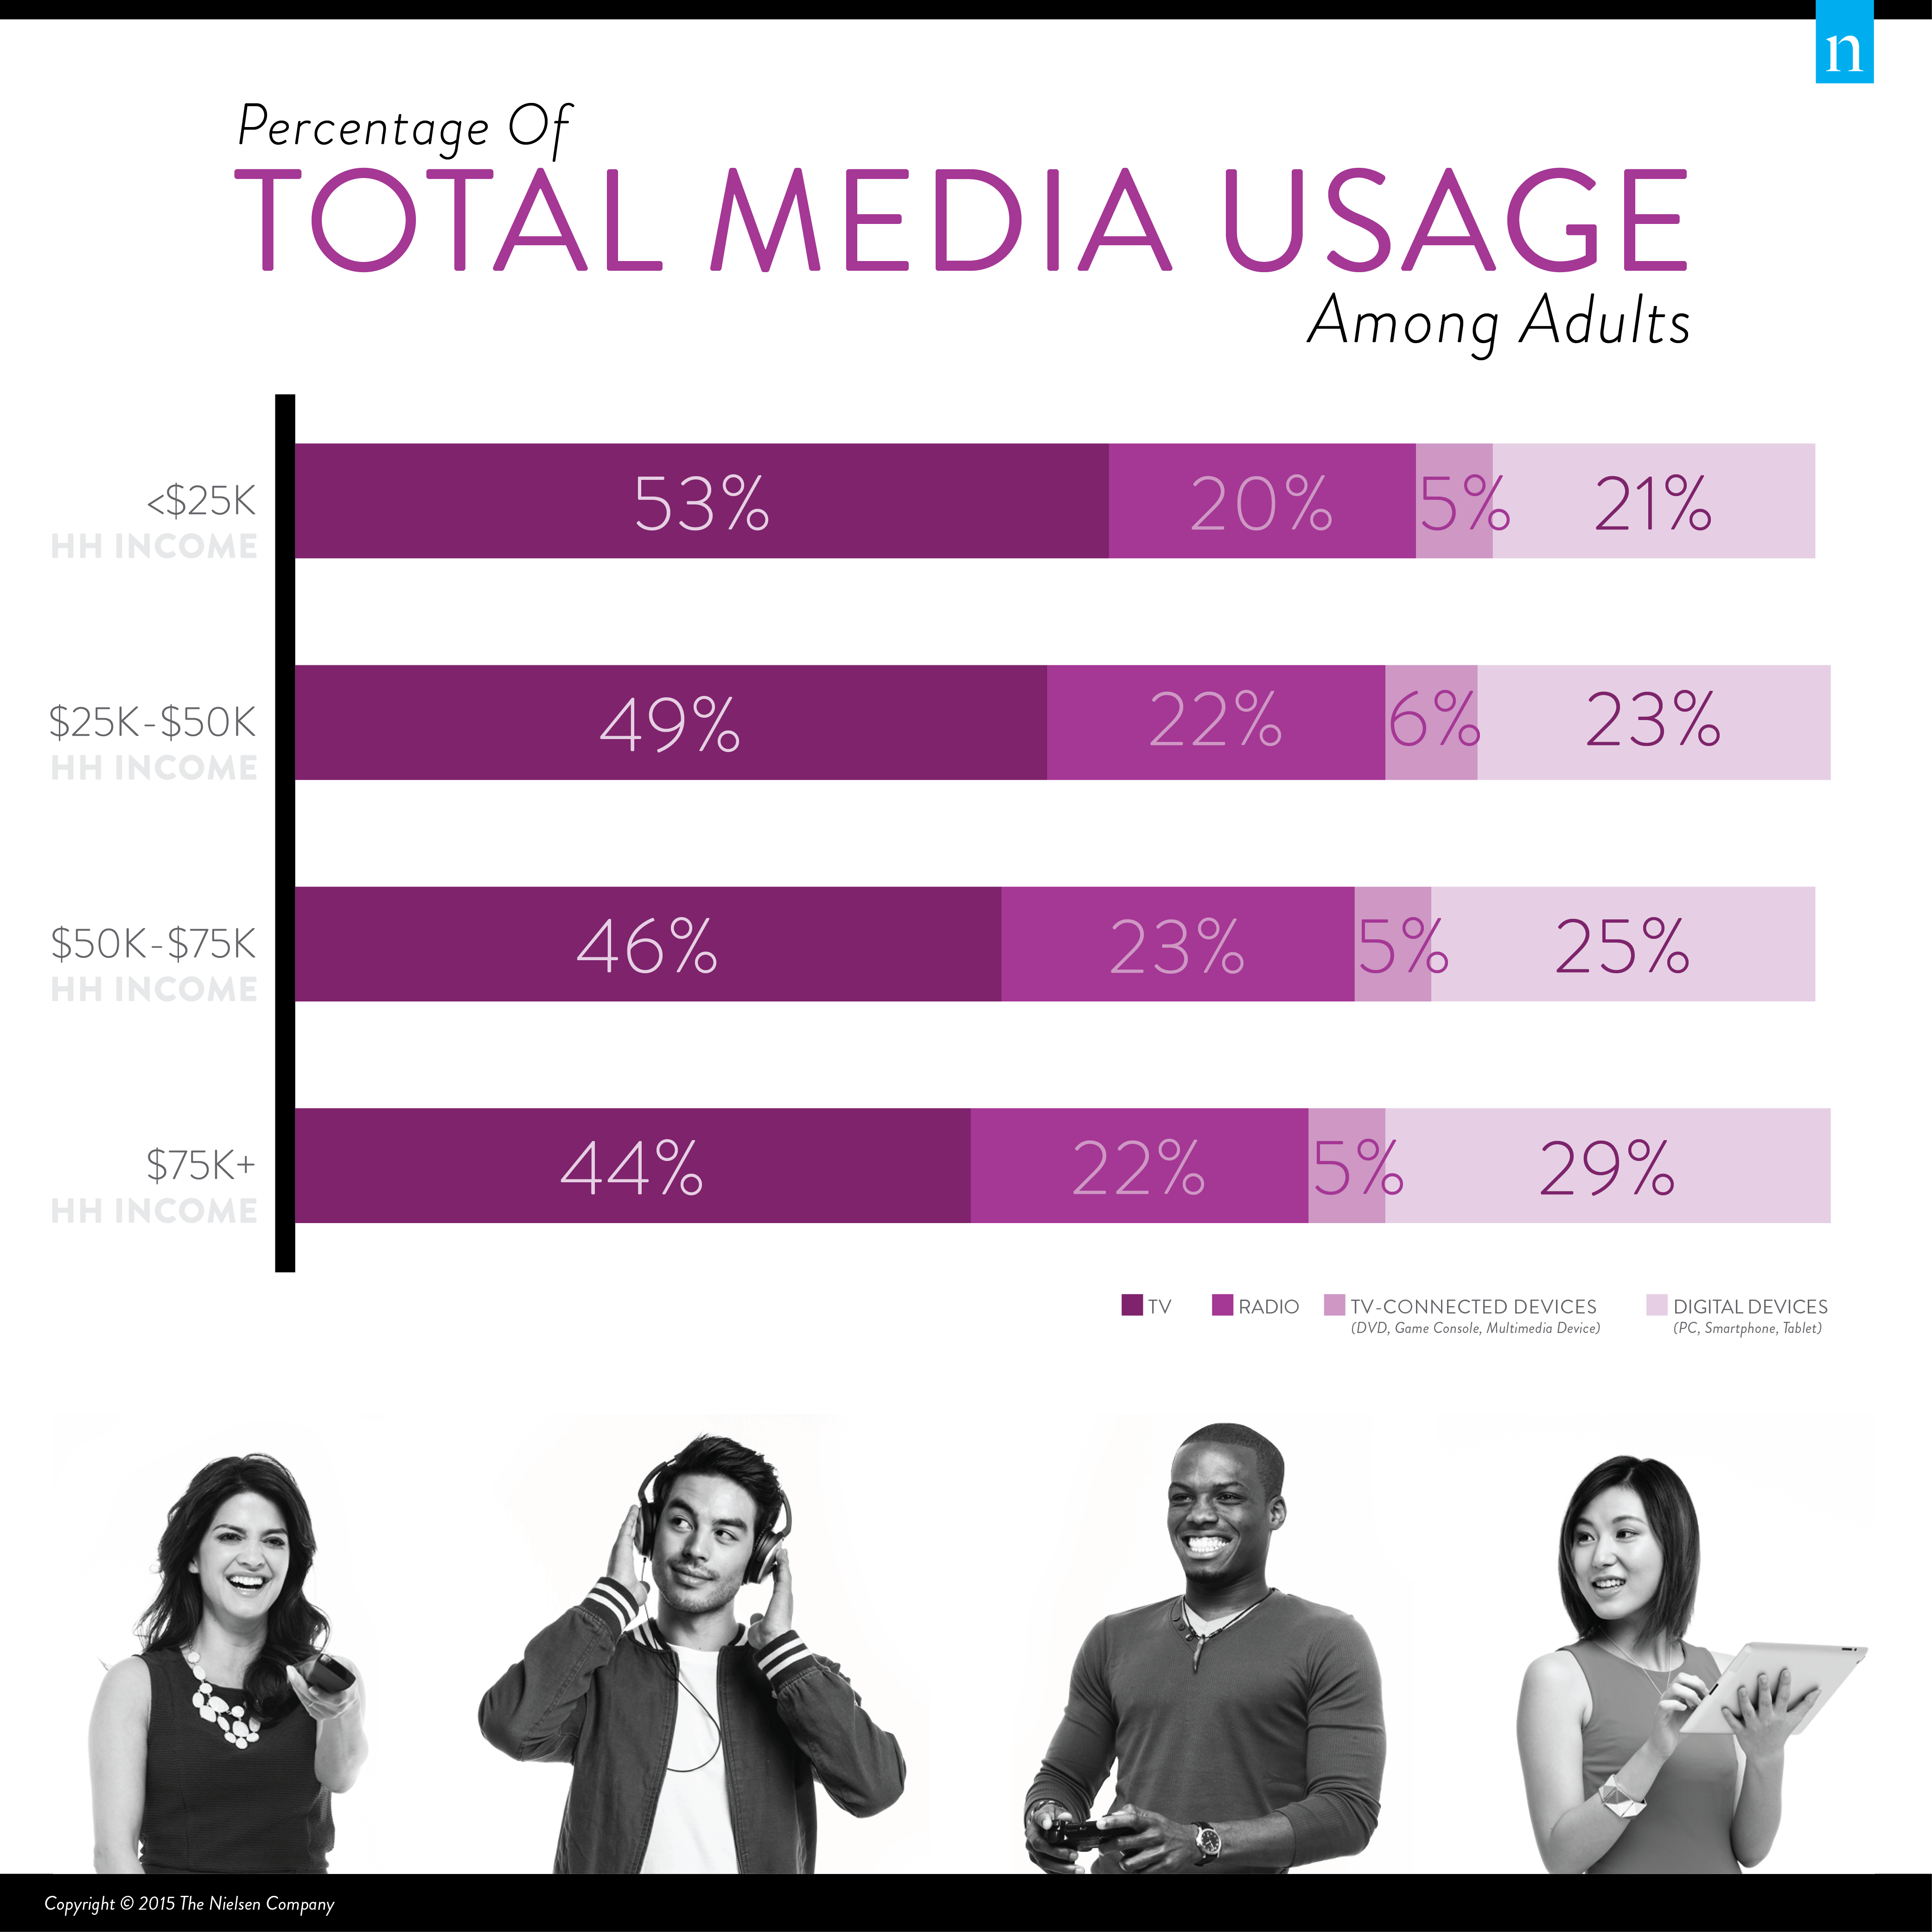
The common axiom that says waste not, want not rings especially true when it comes to the media diet of U.S. consumers. According to Nielsen’s third-quarter Total Audience Report, which focused on media habits in different economic strata, it comes down to ownership and usage.
While people with higher-incomes tend to have more access to tech advancements at their collective fingertips—be it that trendy new tablet or a streaming service with a much-ballyhooed program—consumers that make less money actually spend more time with the media they spending their hard-earned money on!
The report looked at 10 different devices/services and found that penetration followed the same pattern in every instance: homes with higher incomes had more devices/services. For example, in August 2015, 38% of adults in homes with an income of less than $25,000 per year had access to a video game console. In that same period, 58% of adults in homes making more than $75,000 boasted a console within their confines. This trend played out even further among emerging services and technologies, such as tablets, smart TVs and streaming services.
However, just because a home has access to a device or service, doesn’t necessarily mean the homes’ denizens are using them.
In fact, what is sure to be a surprise, the report found that adult users in lower-income households that actually have these devices or services have greater usage—among both traditional and emerging media!
“We expected high-income households to own more devices, but we did not anticipate that low-income consumers of all devices had greater usage,” says Glenn Enoch, SVP Audience Insights, Nielsen. “The media behavior of low-income adults may be concentrated in fewer devices, resulting in more minutes of usage for the devices they own, while high-income adults distribute their time among more devices.”
The report also looked at how the economics of connecting with media played out over multicultural lines and found that money is a great equalizer.
Adults in each income group have the same pattern of ownership of devices/services regardless of race or ethnicity and usage plays out in a similar manner for all income levels.
For example, when looking at adult users of multimedia devices, black homes making under $50,000 averaged more than 33 monthly hours in the third quarter of 2015, Hispanic homes notched about 27 hours, and Asian-American homes had about 41 hours. In homes of these same ethnicities that made over $50,000, the monthly time spent with multimedia devices shrinks to 20 hours (black), nearly 19 hours (Hispanic) and 25 hours (Asian-American).
Knowing the trends in not just ownership, but how different economic levels of all U.S. consumers utilize and access the many devices they have at their fingertips helps provide a new line of sight to programmers and marketers looking to reach a multitude of viewers.