Today’s consumers have more ways to watch what they want, when they want and how they want, as the line between traditional linear TV and digital programming becomes increasingly blurry. And the Millennial generation has been leading this trend, responsible for a large share of the rise in media usage for smartphones, connected TVs, tablet ownership and subscription video on-demand (SVOD) services.
However, while these new technologies are becoming an ever more important part of the overall media pie, live TV remains the primary medium to consume video. And moving into the election season, live TV remains Americans’ first choice when it comes to must-see events, such as political debates and political news coverage.
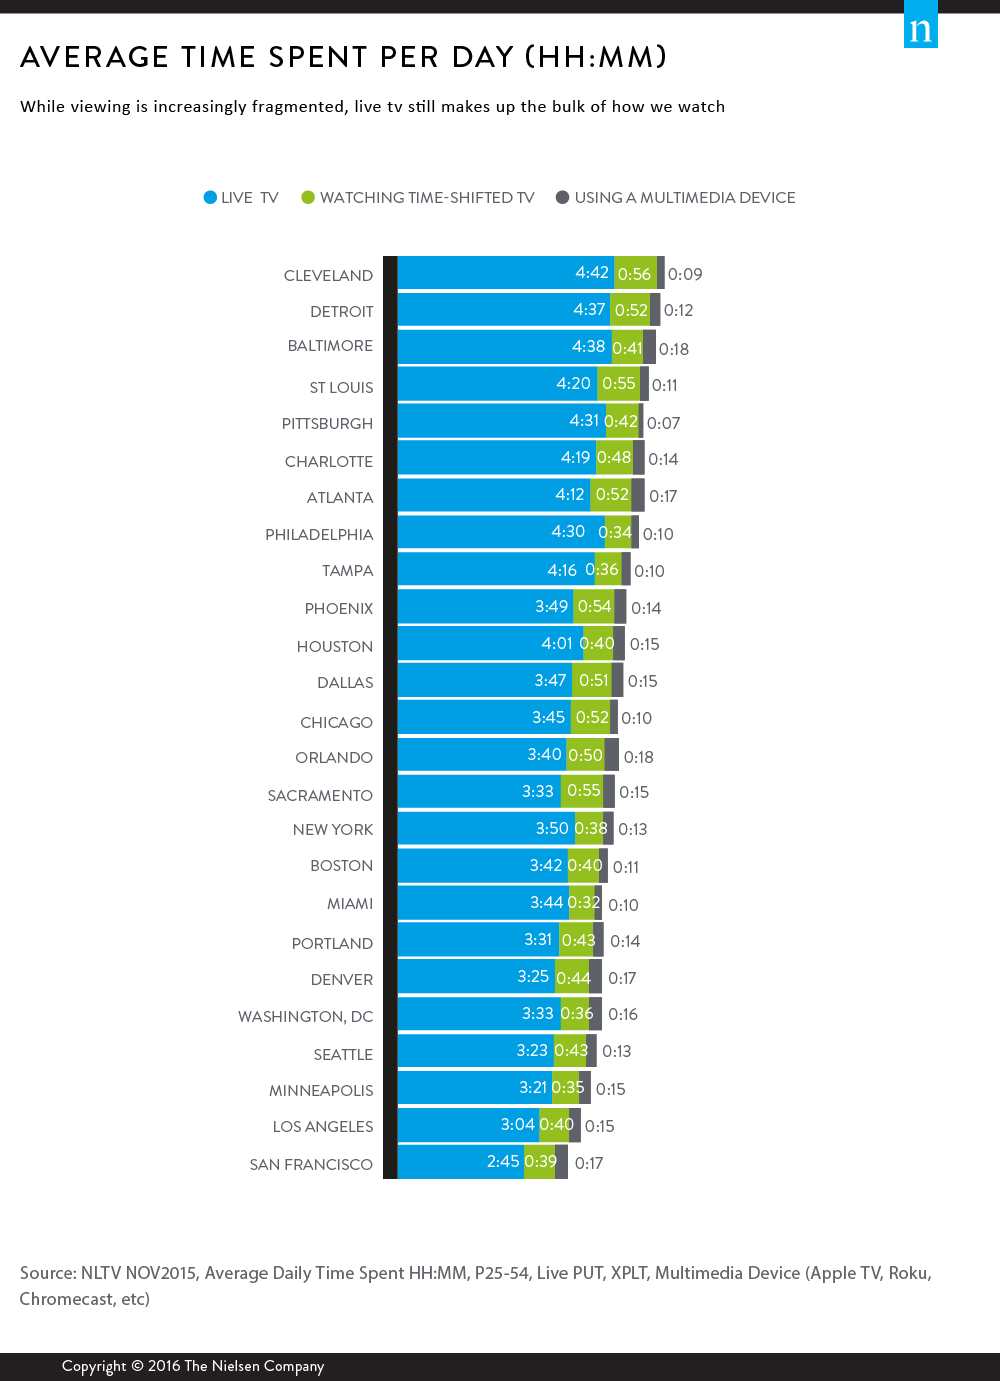
Nielsen’s fourth-quarter 2015 Local Watch Report looks at the degree that the varieties of technologies available to consumers today influence different markets. When we look at the top 25 DMA®s, adults 25-54 watch more than three hours of live TV per day in 24 of them. In addition, SVOD reaches nearly half of the U.S. population, and markets like Philadelphia, Pittsburgh and Dallas have experienced gains of up to 15% in one year. Adults 25-54 in all 25 DMAs spend on average more than 30 minutes of viewing time-shifted TV and more than seven minutes of viewing on a multimedia devices such as Roku, Apple TV and Google Chromecast.
In nine of the top 10 local people meter (LPM) markets, African-Americans watch more than five hours of live TV per day. Among the top 10 Hispanic LPM markets, live TV viewing averages more than three hours per day with Denver and Phoenix tuning for more than four hours.
Smart TVs are found in 20% of U.S. households. Urban centers like Washington, D.C. and Seattle are leading the way in terms of ownership. Orlando, Denver and Detroit are also seeing fast adoption rates and over the past year have experienced a 9% to 10% growth each.
The fourth-quarter 2015 Local Watch Report also shows that smartphone and tablet penetration has increased in local TV markets, which in turn drives content viewing on mobile devices. Tech-savvy markets such as San Francisco, Portland and Washington, D.C. top the list for many of these technologies. In the past 18 months, smartphone and tablet penetration grew by low to mid-double digits in St. Louis, Tampa and Sacramento. As smartphone penetration continues to grow so does the percentage of people who watch video on their device. Since November 2014, Minneapolis, Baltimore and Miami have each seen a 5% gain.
Young Voters and Media Usage
In every election year, and especially during presidential elections, local TV plays a major role in connecting candidates with voters—including young voters. This highly coveted group of adults 18-34 has been growing over the past several election cycles and now makes up 26% of U.S. adults registered to vote in their district. Understanding their media touchpoints, lifestyles and voting habits is key to capturing their attention, and for candidates, knowing where to find these voters is crucial. Of the top 25 LPM markets, nine are in battleground states and, in six of them, young voters comprise at least 25% of adults registered to vote in their district.
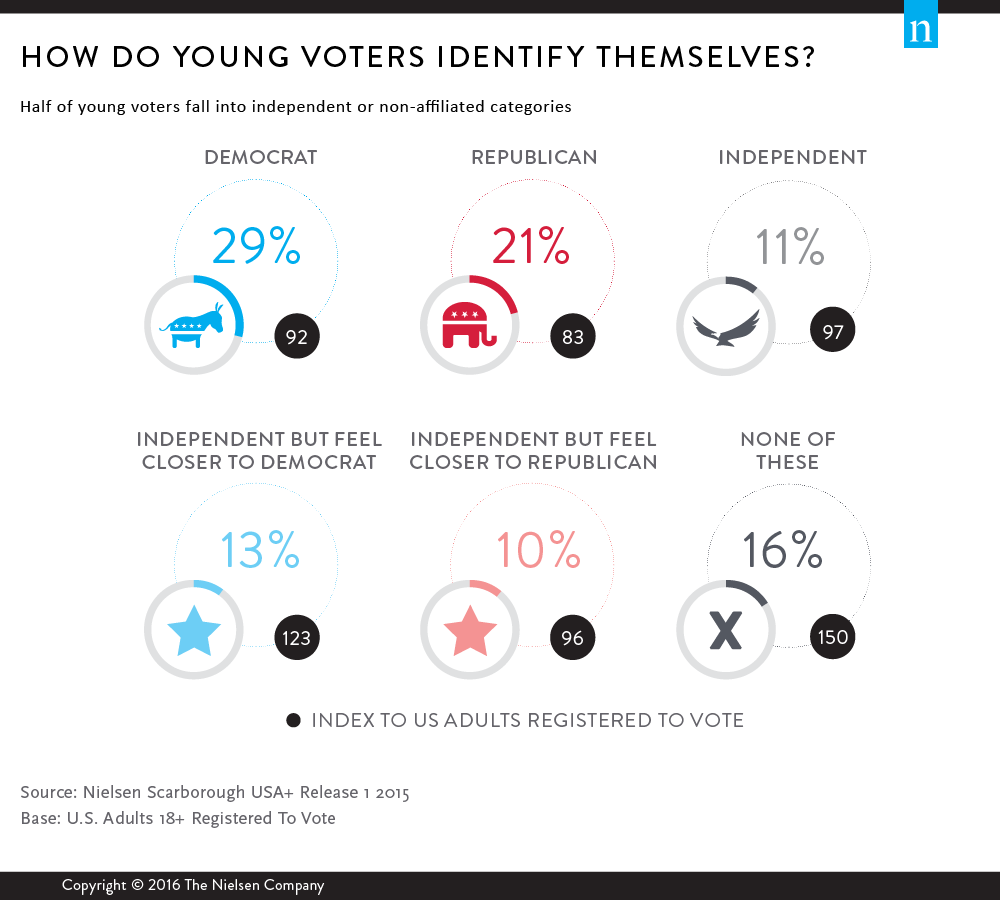
When asked, half of young voters identify themselves as either independent or non-party affiliated. When we look at the two major political parties, 29% identify as Democrats and 21% identify as Republicans. Today’s young voters are multicultural, single and work white collar jobs. Nearly 40% of young voters are multicultural—18% are Hispanics, 13% are African-Americans and 8% are Asian/other. Interestingly, voters who are single will be strongly represented by African-American women, as nearly half of African-American voters 18-34 are single women (the remainder are single men, married men and married women).
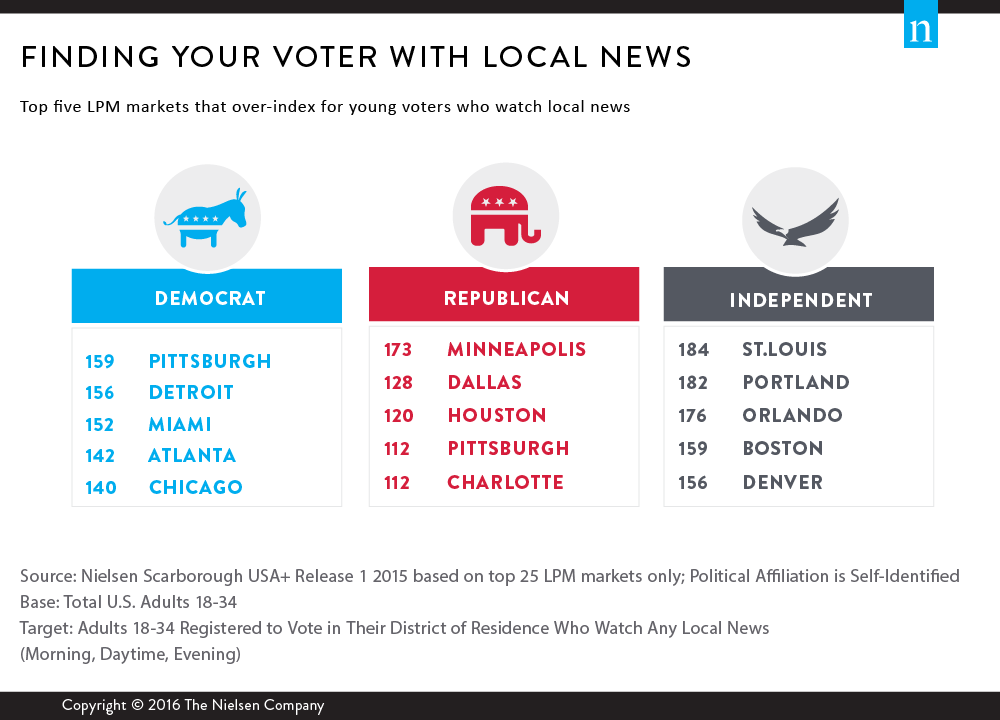
While young voters tend to be early adopters of new technologies and social media, they are still heavily engaged with traditional media. On average, 78% of young voters watch broadcast TV weekly and 49% typically tune-in to local news. In cities such as Charlotte, Pittsburgh and Miami, which are in battleground states, young voters are up to 76% more likely than the average 18-34 adult to watch local news. This group is always on-the-go, and they use the Internet and mobile media apps to stay connected with what’s happening in their community, access traffic and weather reports, or receive local news.
There is no doubt that today’s media landscape is changing, and for viewers, it’s a win-win as they are accessing content on their own terms. For political campaigns and candidates, these changes require them to be more strategic in how they connect with voters, especially younger voters, who can be reached through a large variety of platforms. In local markets, traditional media paired with digital and social media can be an effective way for political campaigns to connect with young voters at home or on-the-go—via live or time-shifted TV and streaming services or mobile devices.
Methodology
The insights from this article derived from various services including Nielsen Local TV View (NLTV), NPOWER Nielsen Custom Data, Mobile Insights and Nielsen Scarborough USA+.
- NLTV provided insights regarding the overall average time spent per day, average time spent viewing per day by Hispanics in the top LPM markets and average time spent viewing per day by African-Americans in the top LPM markets. The surveys took place in November 2015 and focused on persons 25-54.
- NPOWER was used for insights regarding smart TV capable and enabled households. The data reflects household scaled installed percentages based on Nov. 15, 2015.
- NPOWER was leveraged to survey installed count of homes with access to a SVOD service. Data reflects household scaled installed percentages based on Nov. 15, 2015.
- Mobile Insights analyzed smartphone penetration for persons 13+ during November 2015 versus November 2014.
- Nielsen Scarborough USA+ Release 1 2015: Base: U.S. Adults Registered To Vote In Their District Of Residence; Base: U.S. Adults 18-34 Registered To Vote In Their District Of Residence