When it comes to gridiron greatness, NFL teams can notch up wins in ways different from on-field records.
In fact, according to a recent Nielsen study that ranked overall media exposure of all 32 NFL teams during the regular season, some fared better nationally, some had higher local indices and others scored big on the social scorecard. Specifically, the analysis used a weighted system for national ratings and appearances, local ratings, social reach and online visits in order to rank each team’s “exposure potential.”
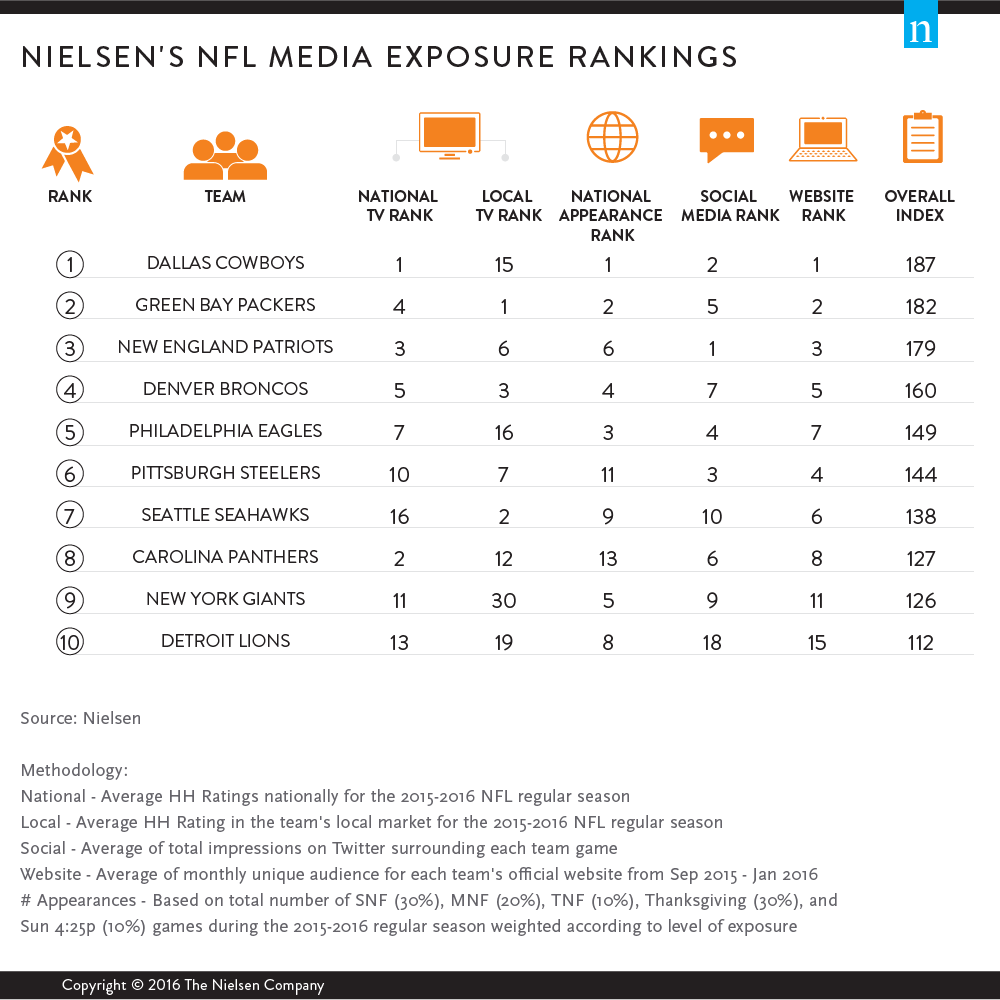
For the Dallas Cowboys, individual rankings didn’t matter much, as the team finished no less than second in four out of five categories (with a field goal’s worth of No. 1 rankings to boot). Even at the hands of a 4-12 season last year, “America’s Team” still managed to garner the most media exposure among its franchise competitors.
But the Cowboys weren’t the only team to prove that there are other box scores where teams can put up points. Teams can value their exposure using different methods, with each form holding unique significance depending on their market.
“All professional sports franchises—not just NFL teams—have an increasing ability to leverage different forms of media in order to connect with, activate and grow their respective fan bases. Teams in smaller markets now have an opportunity to grow their brands nationally and, better still, globally,” says Stephen Master, SVP and Global Head of Sports, Nielsen.
Following in close second were Aaron Rodgers and the storied Green Bay Packers, scoring a 182 on the Nielsen Sports Media Exposure Index—meaning the team’s total media exposure was 82% higher than the NFL team average for the categories analyzed. The only community-owned team in the NFL showed just how important it is to the Green Bay area by ranking highest when it came to Local TV ratings.
Other teams heavily rooted in their communities held top spots in the local rankings as well. Despite double-digit finishes in the other categories, the Buffalo Bills and New Orleans Saints placed in the top five locally.
Social media has fast become a way for brands to connect with consumers and drive messages, and in the NFL, franchises and even players have successfully leveraged social to do so. Fueled by the celeb status of one of the league’s most well-known players and a scandal involving deflated footballs, the social universe took note. Based on the average total impressions of Tweets surrounding each game telecast, the New England Patriots were the most dominant team in the NFL from a social standpoint.
The Giants and Jets had top 10 finishes in the social media category as well. The electrifying Odell Beckham, Jr. of the Giants, and his battles with Washington’s new cornerback, Josh Norman, helped lead the team to ninth place in the category. Meanwhile, the Jets placed just ahead of their MetLife Stadium roommates at number eight.
Winning records didn’t necessarily correlate to higher indices. In fact, four out of the top 10 teams in the Exposure Ranking analysis didn’t even make the playoffs last season. The Super Bowl champion Denver Broncos, bolstered by top 10 finishes in all categories, were able to crack the top five, while reigning MVP Cam Newton and the Carolina Panthers finished eighth overall.
The Chicago Bears and Philadelphia Eagles–two larger-market teams that missed the postseason–still scored wins despite less-than-stellar records. The Bears finished sixth in national TV rankings and ninth in website Rankings (where popularity is based on average monthly unique audience). The Philadelphia Eagles even had top 10 finishes in four out of five categories, one of which was the number three spot for number of appearances in prominent televised games.
METHODOLOGY
The Nielsen Media Exposure ranking measured all 32 teams in five categories during the 2015-16 season: local TV ratings, national TV ratings, national appearances, social impressions (Nielsen Twitter TV Ratings) and monthly unique audience to official team websites. For each category, an NFL team average was calculated and the relative scores of each NFL team were indexed against the average. The indices of all five categories were then aggregated into an overall Nielsen Media Exposure Index, utilizing a weighting system according to the category’s “exposure potential.”