How do you watch video? Chances are high that you watch video across a number of channels and from a variety of sources. Thanks to the evolving media landscape over the past five years, consumers have never had more choice. Today, we watch video across mobile, gaming and other platforms, all of which have enhanced the viewing experience in the living room. And with so many connected TV options, Americans spend a collective 8 billion hours using these devices in a given month. While traditional, linear TV still accounts for the majority of viewers’ watch time, we’re in the midst of a major transformation within the over-the-top (OTT) landscape.
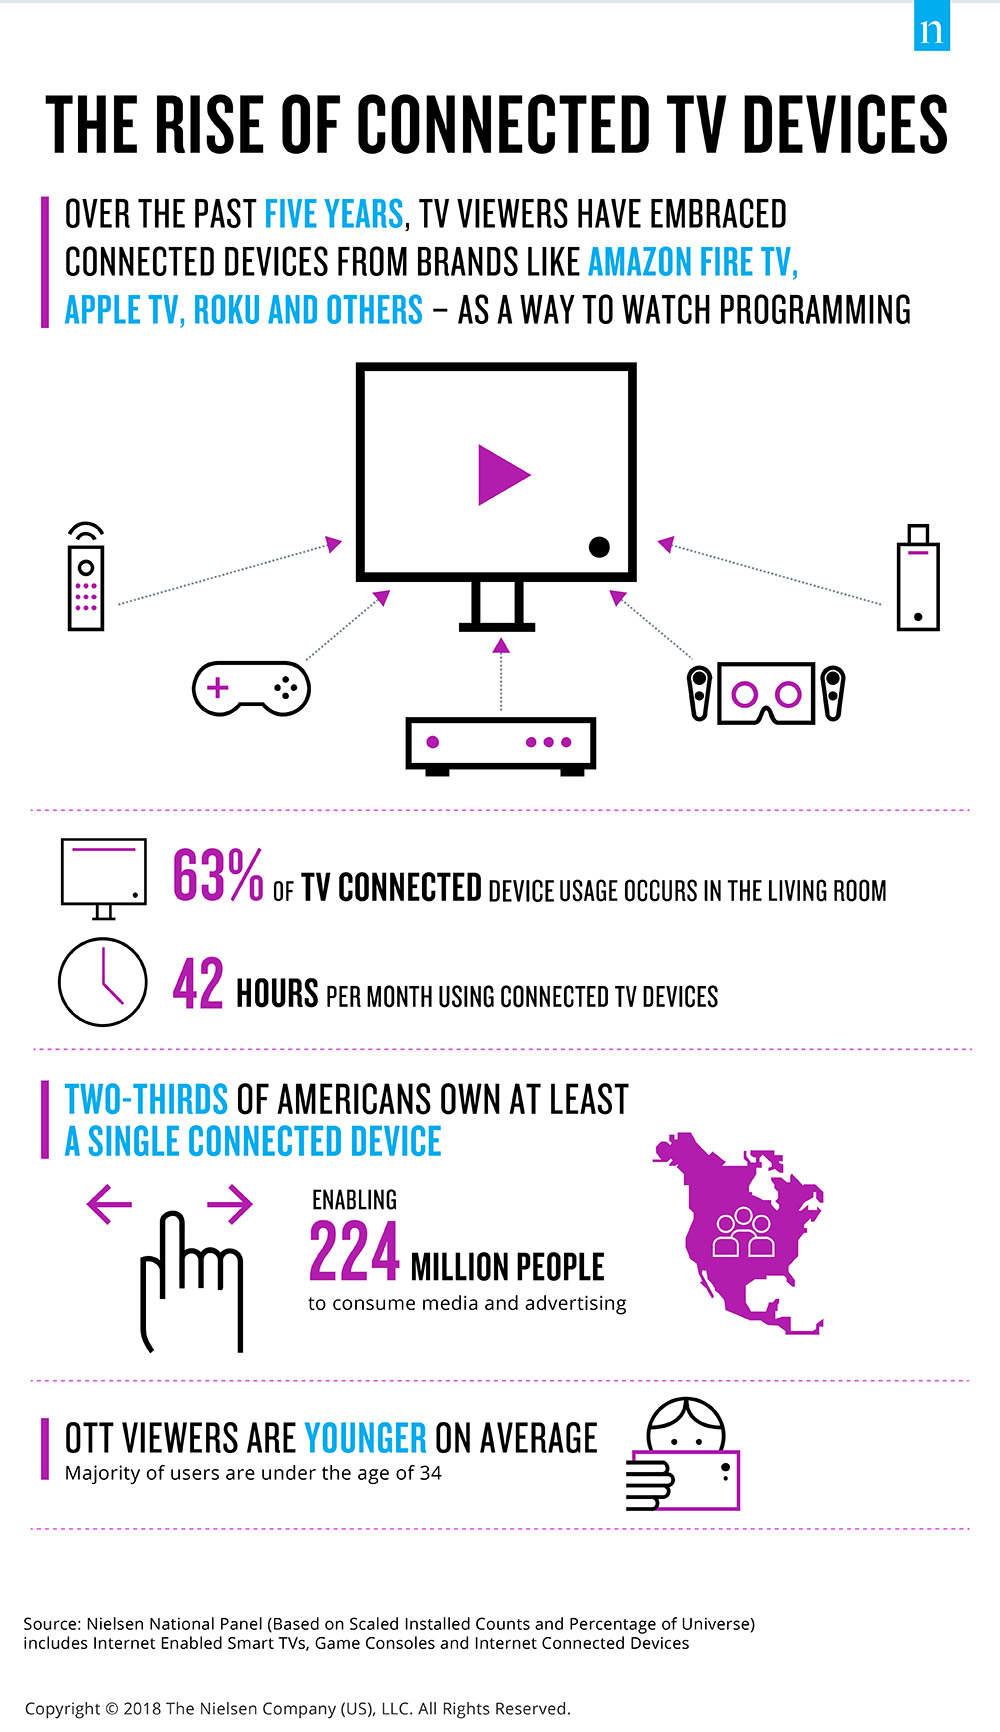
In fact, two-thirds of Americans own at least a single connected device today. That means 224 million people can consume media and advertising on their terms, from catching a live episode of their favorite sitcom to binge-watching an entire season of a show through an OTT app. Yet despite the immense freedom that OTT offers, nearly 63% of TV connected device usage occurs in the living room. And as a result, living room viewing has become a more personalized, choice-driven experience that has opened the door to new opportunities for advertisers to connect with consumers.
Connected TV users will spend 42 hours per month on devices like Roku, Amazon Fire and AppleTV. As OTT consumption becomes more mainstream, we’re seeing more digital-first and TV media companies invest in new connected TV offerings and direct-to-consumer streaming services.
So who’s watching OTT video via connected TV? Our research shows that these viewers are younger on average, with people under the age of 34 spending the most time watching on these devices. Homes with streaming devices are also 30% more likely to be higher income, earning more than $100,000 per year. All of these traits have made connected TV audiences the focus for advertisers looking to have a clear look into audiences and their behavior in order to successfully execute campaigns and cultivate strong brand connections.
Methodology
The insights in this article were derived from the following sources:
- Nielsen National Panel (based on scaled installed counts and percentage of universe); includes internet-enabled smart TVs, game consoles and internet-connected devices
- Nielsen NPower, how many (in millions), based on Universe Estimates from Jan.15, 2018