Social media continues to influence how consumers interact with brands and share content every day. Increasingly, TV viewers leverage social media as a platform to talk about and engage with TV content. These conversations are not only opening new channels for consumer engagement with their favorite TV shows and fellow fans alike, but also are providing insight into which viewers are driving the conversations and when. A recent analysis by NM Incite and Nielsen sheds light on which demographics are engaging with TV across social media and highlights some differences in composition between the general social media population and the population on social media sites talking about TV specifically.
| Who Is Talking About TV? | |||
|---|---|---|---|
| General Online Population (%) | Social Media Population (%) | Population on Sites Talking About TV* (%) | |
| Male | 47% | 45% | 55% |
| Female | 53% | 55% | 45% |
| 16% | 34% | 12% | |
| 18-24 | 9% | 10% | 14% |
| 25-34 | 16% | 17% | 29% |
| 35-49 | 26% | 27% | 30% |
| 50+ | 32% | 31% | 24% |
| Hispanic | 12% | 12% | 13% |
| Non-Hispanic | 88% | 88% | 87% |
| White | 78% | 78% | 76% |
| Black or African American | 11% | 10% | 12% |
| Asian or Pacific Islander | 3% | 3% | 4% |
| Other | 8% | 8% | 8% |
| Source: Nielsen and NM Incite Volumes represent the average March 2011 site visitor demographics for the top ten boards, blogs, groups, Twitter, and Video and Image sites discussing television in general. |
The social media population overall, skews slightly higher among females (55%), than males (45%). However, when comparing this demographic split to that of the population on social media sites talking about TV, this split reverses skewing higher among males (55%), than females (45%). There are several interesting demographic shifts when comparing general social media users and the portion of the population talking about TV specifically on social media. Those under age 18 account for 34 percent of the overall social media population, yet make up only 12 percent of the population on social media sites talking about TV. The opposite shift happens when focusing on the 25 – 34 year-old demographic. This age break comprises 17 percent of the overall social media population, but jumps to 29 percent of the makeup of the population on sites talking about TV. Within these age groups it’s interesting to note that, the difference in percentages across ethnic backgrounds remains relatively unchanged for African Americans, Asian, Hispanic and Whites.
When are consumers discussing TV?
TV buzz closely mimics traditional ratings patterns as well as a show’s yearly cycle.
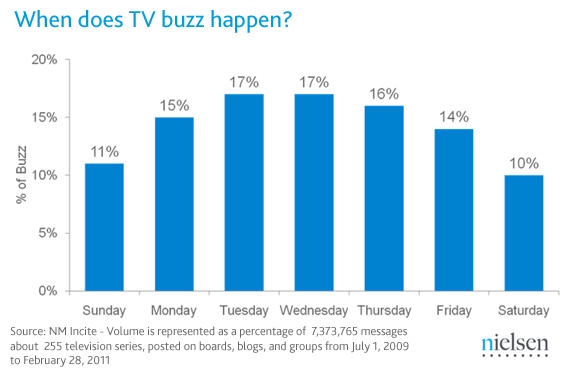
Buzz is highest on Tuesday, Wednesday and Thursday coinciding with days when a lot of major shows air. TV buzz drops off on the weekend and increases once again as the middle of the week approaches.
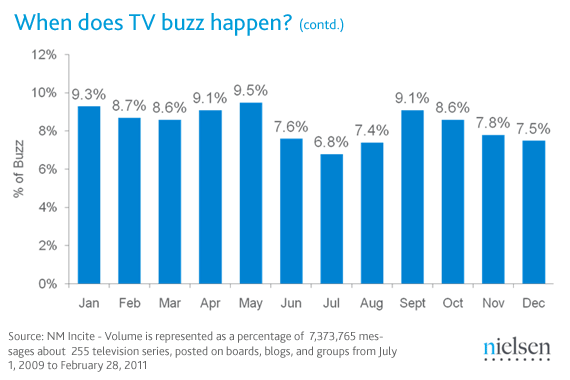
Research shows that TV buzz nears its high during September, right before a show premieres and during its initial month. Conversations taper off slightly over the ensuing months, but increase again in January with the introduction of new and returning shows. TV buzz then seems to peak during April and May as consumers respond to show finales, and then dips again during the summer.
What are consumers discussing?
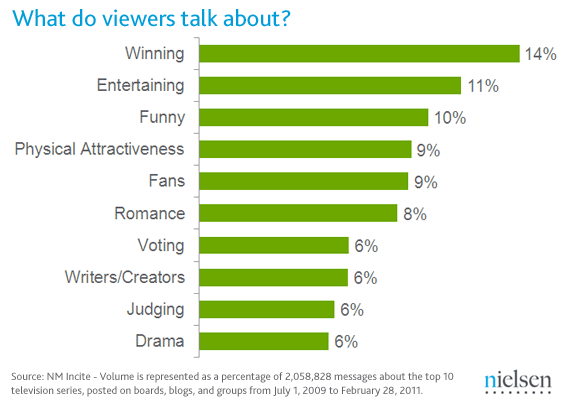
Consumers use social media to talk about a number of key TV-related topics such as winning (14%), voting (6%) and judging (6%), which highlight the appeal of and engagement consumers have with reality-based TV. Top genres fueling the most buzz are funny (10%), romance (8%) and drama (6%). Entertaining (11%), physical attractiveness (9%), fans (9%) and writers/creators (6%) round out the rest of top topics driving consumer discussion across social media.
For more on TV viewers getting social, download research and watch video from Nielsen’s Advertising Week presentations.