In today’s world of growing content options across devices and platforms, reaching the audiences that matter most—be it the DIY dad or the Millennial with wanderlust—is paramount for both TV networks and advertisers. In an increasingly ROI-driven world, marketers are charged with generating revenue growth as efficiently as possible.
While Nielsen’s age and demographics have become the lingua franca of the television audience, it’s no secret that media fragmentation has led to more content—and eyeballs—over a variety of platforms and devices. The resulting complexity has made it more challenging than ever for marketers to efficiently reach their audiences. That’s where “buyergraphics” come into play. A recent Nielsen analysis found that supplementing traditional demographics with buyergraphics, or audience segmentation and insights based on purchase behavior, can further help advertisers reach their best consumers.
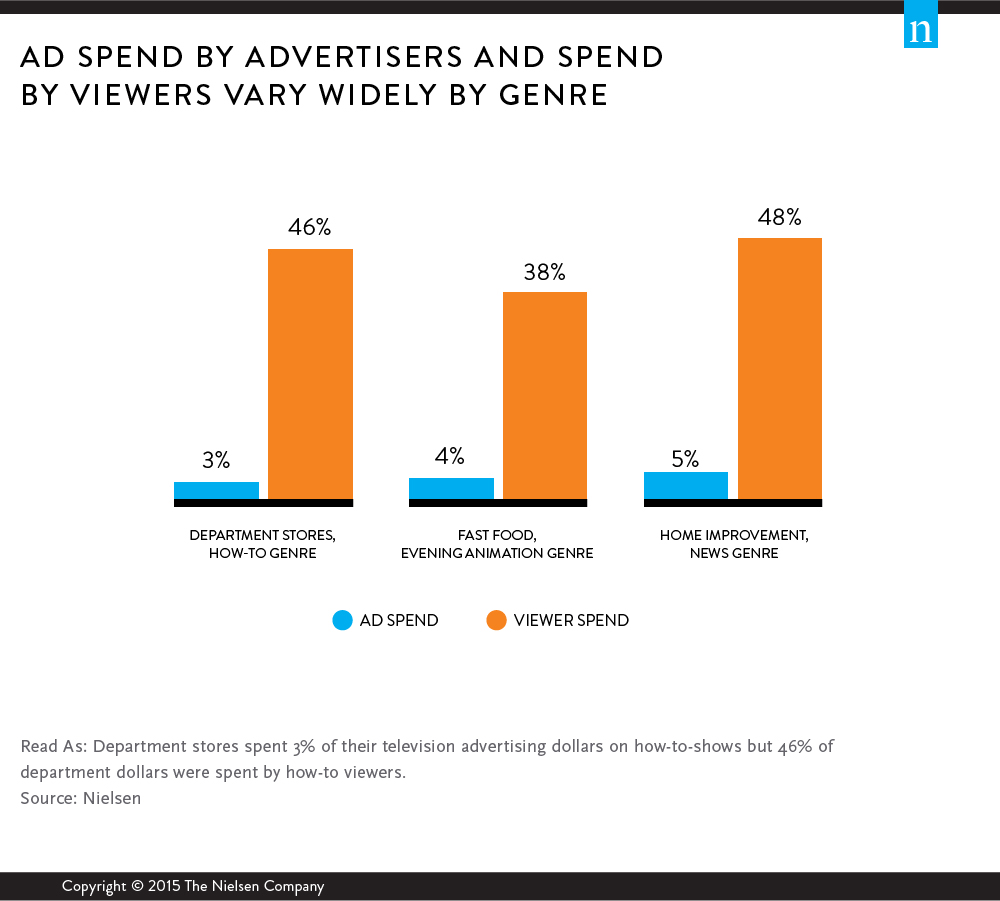
The analysis used Nielsen Buyer Insights, which combines consumer purchase data and TV viewing data, to compare current advertising spend by genre and viewer spend by genre, and found several opportunities where advertisers can optimize their TV advertising budget allocation.
For example, U.S. department stores spent more than $1.5 billion on TV advertising last year. Only 2.5% of that was spent on how-to shows, which provide instruction and advice on things like cooking, travel, and other lifestyle activities. However, the audience that watches these shows tends to be heavy department store buyers. In fact, how-to show viewers made up 46% of all dollars spent at department stores last year.
The analysis also found that viewers of evening animation shows also have an appetite for fast food. Advertisers only spend 4% of their ad budget on evening animation shows. Even a small ad spend increase may pay off big. That’s because people who watch evening animation shows are not only more likely to buy fast food, they also buy fast food more frequently. On average, they make seven more trips to fast food restaurants over the course of the year than the average fast food buyer!
Similarly, home improvement advertisers spent only 5% of their ad dollars last year on news programs. Home improvement advertisers are more likely to reach their heavy buyers by advertising on the nightly news than in other genres. Another newsflash—people who watch the news spent 48% of all home improvement dollars last year.
“Marketers are under increasing pressure to prove the ROI of their marketing efforts, and this is further complicated by fragmenting audiences,” said Nada Bradbury, SVP Product Leadership, Nielsen. “In some instances, we’ve seen up to 50% of buyers fall outside of any single demographic segment. By connecting the dots between what people watch and what they buy, advertisers will be better equipped to deliver the biggest bang for their buck.”
Methodology
The insights in this article were derived from Nielsen Buyer Insights, which matches Nielsen’s currency-level TV exposure data with online and offline credit/debit card transactions in an anonymous, privacy-friendly way. The insights reflect data collected between Sept. 22, 2014 and Dec. 28, 2014. The department store annual spend was from Nielsen AdViews, Dec. 30, 2013-Dec. 28, 2014, national TV.
