Embracing today’s digital ecosystem brings both opportunity and challenge. Digital’s influence is far and wide and reaches all demographic segments. It provides marketers with direct ways to engage with unique consumer bases. The fast-pace of change, however, means there are no clear sign posts to follow when it comes to using digital as an ongoing business growth strategy.
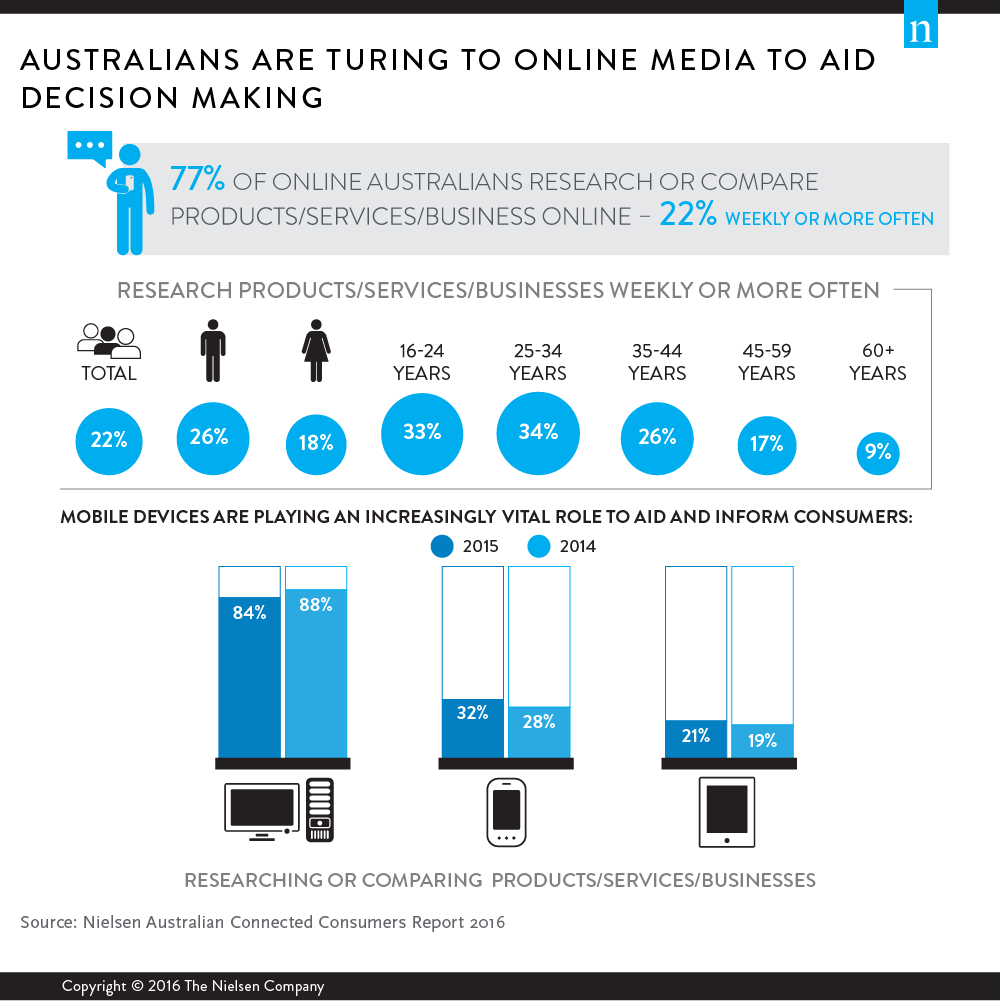
More than three-in-four connected Australian consumers are turning to online media in their quest to find answers and help with their everyday decision-making about products and services.
Consumers are also increasingly relying on mobile devices throughout this decision making process. Video is aiding the process with a continued increase in the number of consumers watching online videos about products and services; more than three in five online Australians do so, (62%), up from just over half (54%) two years ago.
Although there are many similarities in the online activities carried out across different devices, they do play different roles for consumers. Desktops/laptops are still strong for function, research and commerce; while smartphones are heavily used for local and social tasks. Tablets are a happy medium encompassing key elements of both smartphones and desktop/laptops. Connected TV and games consoles usage is driven by entertainment-related activities.
Desktop/laptop usage skews more toward older age groups, while mobile use is heavier among younger age groups and tablet usage is strongest in the middle age groups. As tablet devices are a hybrid of desktops and phones for both audience and function – they are not necessarily developing their own niche. This will be a challenge for tablets in coming years as phone screen options increase and the overall number of connected screens in households increase.
The major differences in male and female usage, apart from obvious content-driven differences, impact both function and device usages. Males are more frequent users of research and functional tools which correlates with their smaller drops in desktop/laptop usage; whereas, females are more frequent social and mobile users.
Although we are still seeing strong penetration numbers for activities on desktops/laptops, the downward pattern in usage levels will become more evident as younger consumers’ strong smartphone usage drives faster mobile growth.
Online activities undertaken on both connected TV’s and games consoles remains low and fragmented in contrast to the number of online consumers that own these devices. Many of the top barriers to accessing content on connected TV’s are addressable, as a substantial amount of owners simply don’t know how to access online content on their device or just haven’t set it up yet. More education and integration within services on these devices is needed to help develop their usage.
Two key areas still remain quite different when it comes to overall online activity patterns for metro and non-metro consumers. Streaming audio visual content is lower in non-metro areas as is accessing news and current information. Audio visual is most likely affected by connection speeds. The difference in engagement with online news indicates that digital services are not meeting local non-metro news and information needs, or perhaps, traditional media sources are not developing adequate digital offerings.
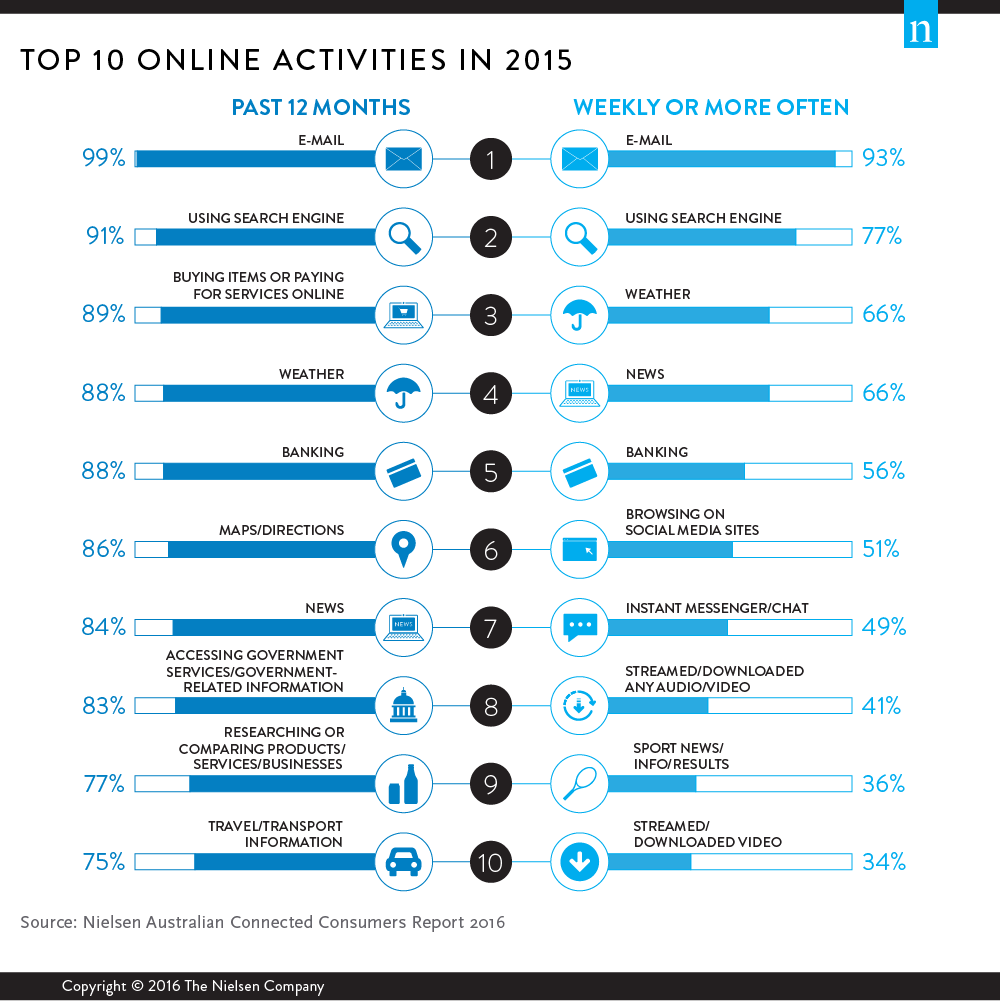
Despite the market seeing an expansion in the types of online communication tools used by consumers, email still remains the method that is used by the highest number of online Australians. Email retains the top spot across mobile devices as well as desktop/laptops. Access by time-of-day influences the type of device used to open an email; and marketers must consider this when planning when and what to distribute via email to consumers.
Although we had previously seen most online consumers having undertaken banking/bill payment activities online, there has been a jump in the percentage of online Australians carrying out these functions at least weekly. This area still skews toward desktop usage but mobile access is growing quickly. As we have noted in the retail section of this publication, organisations will have a distinct market advantage if they can make the mobile experience for what can often be quite complex activities, smooth and easy for consumers.
The past 12 months has also seen an increase in transport/travel utilities carried out on mobile devices, suggesting improvements in functionality for some of the more commonly used services.
Video consumption continues to be the dominant type of audio visual content across all devices; however, 2015 saw uplift in weekly audio streaming and digital radio services. The local launch of iTunes Radio and continued investment from both digital pure plays (e.g., Spotify and Pandora) and traditional radio networks (e.g., Southern Cross Austereo and Nova Entertainment) has assisted in the growth of this sector.
Time-of-day usage for video increasingly resembles the traditional TV viewing curve for most age groups. This pattern continues to solidify with the expansion of long-form content that is made available digitally. This obviously provides both opportunities and threats for the traditional free-to-air and subscription TV services.
Despite much discussion in the market about whether people will subscribe to online content, the gaming, news and sports markets have been successful in converting a section of their most loyal users to a paid model. The gaming market has been the most successful in converting nearly one-in-four games to a paid subscription. However, for all three genres there is still a large amount of trial and churn with consumers continually reviewing alternative offerings in market.
Want to find out more?
Purchase the Online Oracle chapter here or purchase the full Australian Connected Consumer Report 2016 here.
About the Australian Nielsen Connected Consumers Report, 2016The Australian Connected Consumers Report has been published since 1997 and is now in its 18th annual edition. The 2016 report analyses the responses of 4,802 online Australians aged 16 years and above through an online survey methodology. All responses were collected during December, 2015. The report was released on Thursday 31 March, 2016.